
Process Improvement Tools.
Standard Work.
Work Instructions.
Flow Chart templates.
Swim Lane Cross Functional Flowchart.
Value Stream Mapping.
Lean tools.
Yamazumi Chart template.
Time Study templates.
DMAIC tools.
Quality Improvement tools.
House of Quality QFD.
FMEA Risk Reduction.
Root Cause Analysis tools.
Problem Solving tools.
OEE.
Preventive Maintenance.
Skip to main content

Optional ways to handle segments


Installation and Setup
Installation - Each User. Installation - Multi-user. Language Translations. Personalize Your Templates.Systems2win Training.
Quick Start Initial Training. New User Training. Training Matrix. Systems2win Leadership. Training Classes.Lean Training
Lean Training and Coaching. Lean Principles. Muda 8 Wastes. Goal - Lean Flow. Roadmap - Lean Journey. Value Stream Mapping. Standard Work. Hansei Lean Thinking. Lean Dictionary. Online Lean Training. Lean Leadership.Microsoft Office Training
Excel Training. Excel Drawings (without Visio). Excel Charts. Word Training. PDF Training. Document Storage and Naming.Support
Support.Value Stream or Value Chain
What is a Value Stream?
In Michael Porter's 1985 book Competitive Advantage: Creating and Sustaining Superior Performance, he defined a value chain as a chain of activities that a firm operating in a specific industry performs in order to deliver a valuable product or service for the market.
In the 1996 book Lean Thinking, by James Womack and Dan Jones, the definition of a value stream is:
The set of actions required to bring a product or service through the three critical management tasks of any business:
- Problem solving (e.g. design)
- Information management (e.g. order processing)
- Physical transformation (e.g. making a physical product, or delivering a service)
Others have organized the segments of a value stream in other ways,
such as...
Segments of a Value Stream
1. Concept to Launch
Examples:
- Customer quotes (for customized deliverables)
- Custom development
- New product development — design engineering
- Manufacturing engineering
- Engineering Change Orders
Training to get you started.
Tools you won't outgrow.
2. Source Information & Materials to Finished Deliverable
Examples:
- Sales order entry and invoicing
- Customer quotes (for configurable options)
- Sales & marketing
- Purchasing
- Receiving
- Patient intake
- Inventory storage and retrieval
- Prototypes
- Production
- Rework
- Order fulfillment
- Packaging
- Shipping
- Delivery
- Physical returns
- Repairs
- Field service
- Resource use
- Waste management
(solid, liquid, gas, hazardous...)
3. Order to Cash
Examples:
- Accounts receivable processing & collection
- Credit approval
- Accounts payable processing and payment
- Return Authorizations and refunds
- Period end financial processing

4. End of Life Cycle
Some responsible companies that embrace the expanded teachings of Lean to Green also consider the area of the value stream that has traditionally been ignored as "someone else's problem".
Examples:
- Recycling
- Reuse
- Landfill impacts
- End of life hazardous wastes
Other Value-Enabling Support Value Streams
Absolutely every type of multi-step process can be conceptualized as a value stream.
Other examples include: Hire to Retire, IT Support, Budgeting, etc.
Optional ways to handle segments
in your Value Stream Map
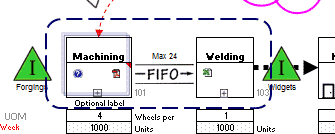
1) Value Stream Loops
Segments within a value stream map
are called Value Stream Loops.
It is common to draw a dashed line around the portion of the value stream map that comprises the loop(s) that you want to differentiate.
Your Systems2win value stream mapping template provides a special shape that makes it extremely easy to draw a box around segment of a value stream map.
If you need to draw a free form shape, (that's not a perfect square or circle)...
just follow our online instructions for how to do that.
Once you learn how to use Excel as a drawing tool, then drawing a value stream loop is truly child's play.
2) Separate Value Stream Map per Segment
Segments shared by multiple value streams
usually have their own value stream map and/or swim lane functional flowchart.
For example, it would be extremely inefficient to attempt to duplicate a shared process like 'Sales Order Processing' on 30 different value stream maps.
The easiest way to handle shared segments
is to simply exclude them as being outside of the (starting and ending process) Boundaries defined in your Value Stream Team Charter.
If you want to include that segment within your Value Stream Analysis Totals then if you know how to use Excel's standard cell linking features,
to instantly update the values in another workbook whenever those value change in the source workbook
(in our example, instantly updating all 30 of your related value streams
every time anything changes in your shared Sales Order Processing value stream)
and you know how to use Systems2win's special features for Paths and Scenarios,
to instantly switch between different possible scenarios — using a single value stream map
then you can quickly analyze your Value Stream Totals with or without the extended value stream segments by simply switching between Scenarios.
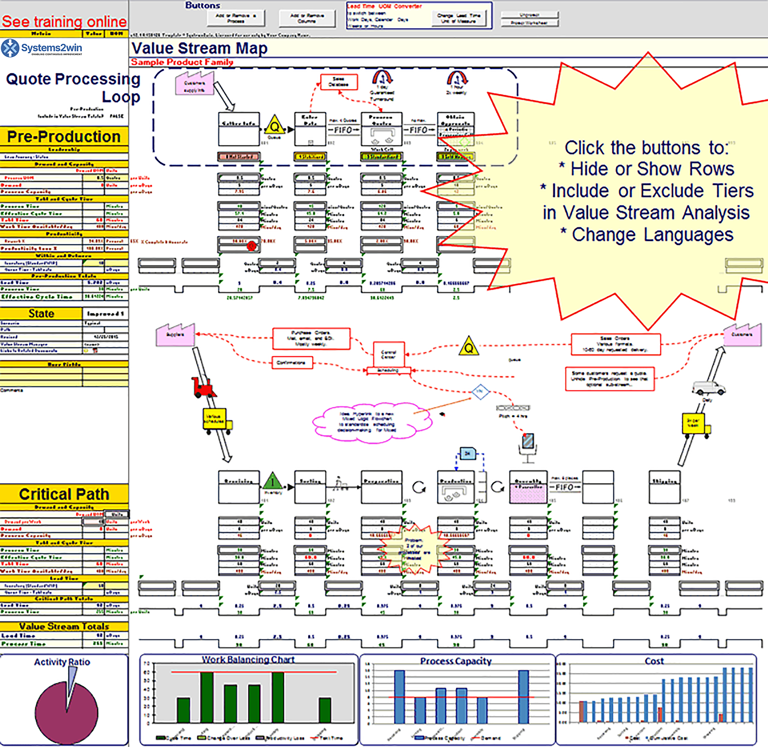
3) Multi-layer Value Stream Map
aka Multi-tiered, Multiple Tiers, Multi-Stream Map, or Layered Value Stream Map
Segments immediately before and after the main value stream
can optionally be shown on the same map in the optional Pre and Post-Production tiers
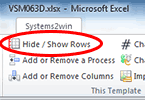
Simply click the 'Hide/Show Rows' button
Excel Ribbon bar > Systems2win tab > Hide / Show Rows
to show the tier of Pre-Production Processes
(above the tier of Critical Path Processes)
and/or the tier of Post-Production Processes
(below the Value Stream Analysis section near the bottom)
Pre and Post-Production Tiers
Multi-layer Value Stream Map - using your Value Stream Mapping template
How to use the Pre and Post-Production Process tiers
The flow of "the thing being transformed" always flows from left to right.
Remember, every column containing a Process Box is always paired with the column to it's right, and some shapes (like the FIFO shape) have arrows pointing to the right.
You're going to confuse your audience if you draw your Pre-Production tier with the flow going backwards.
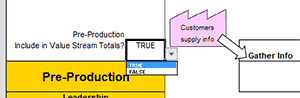
To include or exclude the Pre or Post-Production tier from Value Stream Totals Analysis
simply select TRUE or FALSE from the dropdown list in the field just above the section row headers.
To hide or unhide rows
If you're going to use either the Pre or Post-Production tier on your value stream map,
then in the Hide Rows column, you can delete the word 'TRUE' for any rows that you will usually want unhidden, so that you can use the 'Pre Post' button to quickly hide or show your desired rows, and then if and when you want to hide the entire tier, you can simply use Excel's normal Hide Rows feature.
Extra Credit
for those who want to understand more
One of the first things to do when value stream mapping or flowcharting is to define the first and last steps of the segment of the value stream that you will then map, analyze, improve, and control.
It is helpful to understand that Lean Office often focuses on segments within the first and third areas found within every value stream, while Lean Manufacturing and Lean Healthcare tend to focus on segments within the central second area of the value stream.
(By "Area", we mean the 4 major categories of Value Stream Segments — defined above.)
While there is always only one value stream per Product Family, it is not uncommon:
- for several value streams to share common segments
- to have multiple value stream maps for a single value stream, perhaps:
- a cross-company supply chain VSM
- a traditional value stream map with a high-level perspective perhaps with some Process Boxes that might drill down to...
- several more detailed VSM's — each focusing on different segments perhaps with some Process Boxes that might drill down to other non-VSM lean tools — such as flowchart, standard work, spaghetti diagram, standard procedures, work instructions, etc.
In the Source to Deliverable segments (defined above), there is often a one-to-one correlation between:
- a Process Flow Box on a value stream map
- and the various drill-down-to-detail documents within that Process Flow Box
In the other segments, it is not uncommon for the drill-down-to-detail documents to be common to many value streams (or even every value stream in the business; think Accounts Payable, Sales Order Processing...) so it is more common to find detailed documents that are not specifically linked to any higher value stream map.
It is still helpful, however, to understand that every process is part of one or more value streams — whether or not anyone has yet taken the time to define the relationships.
Return to training for Value Stream Mapping, and Value Stream Analysis
Contents
When to use this tool
in a Typical Lean Journey for Lean Transformation
- Phase 0)
Firefighting - Phase 1) Prepare Your Leadership
- Phase 2) Design Value Streams to Flow
- Phase 3) Analyze, Stabilize, Visualize, and Standardize each process
- Phase 4) Continuously Improve
Road map for a typical
Lean Transformation
Training and Videos
Your Systems2win templates come with Training & Videos to get the most from your process improvement tools
Contact us to learn more
Training and Coaching
Consider Training and Coaching to support your teams to succeed
The right tools to
Define, Measure, Analyze, Improve, and Control
your value stream maps
(not just draw them)
Tell a Colleague
150+ Templates
Try Some
Own Them All
Download Trial Now
Get a dozen trial templates,
and another dozen free gifts
@@@ Better conversion rate
if call to action is for a specific tool, and shows the image
Try It
Try this template
along with a couple dozen more
process improvement tools
Calls to Action Botttom

Related Topics
Related Topics section WITHOUT TESTIMONIALS
Replace this paragraph with menu library item for topics related to this video
Training and Coaching
Consider Training and Coaching to support your teams to succeed
Training to get you started.
Tools you won't outgrow.
Schedule a Conference
Schedule a conference
to discuss your challenges
with an experienced lean advisor