
Process Improvement Tools.
Standard Work.
Work Instructions.
Flow Chart templates.
Swim Lane Cross Functional Flowchart.
Value Stream Mapping.
Lean tools.
Yamazumi Chart template.
Time Study templates.
DMAIC tools.
Quality Improvement tools.
House of Quality QFD.
FMEA Risk Reduction.
Root Cause Analysis tools.
Problem Solving tools.
OEE.
Preventive Maintenance.
Skip to main content


Installation and Setup
Installation - Each User. Installation - Multi-user. Language Translations. Personalize Your Templates.Systems2win Training.
Quick Start Initial Training. New User Training. Training Matrix. Systems2win Leadership. Training Classes.Lean Training
Lean Training and Coaching. Lean Principles. Muda 8 Wastes. Goal - Lean Flow. Roadmap - Lean Journey. Value Stream Mapping. Standard Work. Hansei Lean Thinking. Lean Dictionary. Online Lean Training. Lean Leadership.Microsoft Office Training
Excel Training. Excel Drawings (without Visio). Excel Charts. Word Training. PDF Training. Document Storage and Naming.Support
Support.Process Analysis Tools
Process Analysis tools and templates for lean process improvement
Ideally, every organization will evolve their own standardized ways to systematically analyze their unique types of processes, but every organization will benefit from first becoming familiar with the popular process analysis tools and tools for standardized work that other organizations have found useful.
Popular process analysis tools
Process Analysis template
Use your Process Analysis template (Analysis.xlsx)
to analyze (and manage) any lean metrics for any type of process.
See full training for your Process Analysis template in the lower sections of this page.
Value Stream Mapping
Use your Value Stream Mapping template (VSM.xlsx) to analyze and improve flow between processes in your value stream.
Usually, it is wise to analyze (and make visual) the flow between processes before then analyzing and improving flow within each process
using any or all of the other process analysis tools described below
Flow Charts
Flowcharts are by far the most popular tools for process analysis.
See online training for the many types of flowcharts and how to use your versatile (humble) flowchart template (FlowChart.xlsx) for many diverse types of process analysis.
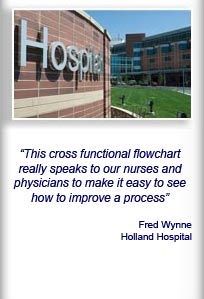
Swim Lane Functional Flowchart
Use your Functional Flowchart template (FunctionalFlow.xlsx) to analyze and improve flow within a process that has a lot of handoffs.
Unlike a simple flowchart your Swim Lane Functional Flowchart has lots of math to perform 'deep-dive' process analysis with Lean Metrics and charts that Visio simply can't do.
Process Reengineering
Use your Process Reengineering template (Reenineering.xlsx)
to clarify details that don't fit neatly into a swim lane flow chart, and to untangle and re-design even the most complex process.
And if people's jobs are impacted...
Use your Jobs Design Matrix and Change Management templates.
Standard Work
Your Standard Work template (StdWork.xlsx) is perhaps the most powerful tool in your lean toolkit to analyze and improve flow within each process in your value stream.
You will often start with simpler process analysis tools but this is the tool that will save your career
when your top management starts asking the tough questions, like:
"How much does it cost?"
"How many can we make?"
"What if... we reduced setup times? demand changes? we tried something different?"
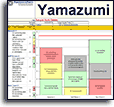
Yamazumi
Your Yamazumi template (Yamazumi.xlsx) is an easier tool to answer a few of the same questions
"How might we rearrange tasks between workers?"
"Where should we focus our improvement efforts?"
Quality Analysis
A specialized type of process analysis is Quality Analysis to ensure that your process is capable
of meeting your specifications.
Your Systems2win templates come with an entire suite of Quality Tools for those times that your process analysis efforts need to focus on quality.
What is process analysis?
Broad definition
Any way of studying a process.
More helpful definition
Any way of studying a process that is systematic, teachable, repeatable and thorough enough to consistently and obviously reveal those aspects of the process that have the greatest effect on desired and undesired process outcomes
Two competing approaches for
How to do lean process analysis
Surprisingly, there are two competing philosophies for how to approach process analysis:
1) As a combined activity
Simultaneously:
- analyze the process
- and identify the 7 types of wastes
Waste walks are especially popular in lean healthcare and other environments that have a large number of people that don't have a lot of process improvement experience, and still have lots of opportunities for low-hanging fruit because people have not yet developed a lean culture or "eyes for seeing waste".
2) Split those into two separate exercises
For example, if you are following the teachings of the Lean Improvement Kata, you are discouraged from random identification of wastes not specifically related to the one (and only one) Obstacle that is the focus of your current cycle of PDCA Coaching. (PDCA.xlsx)
Why? Two reasons:
- Because you want to focus only on those wastes that are specifically obstructing achievement of the Strategic Target Challenges that are the current focus of your organization-wide Strategic Objectives.
- Because the process is rapidly changing with each PDCA Coaching Cycle,
so time spent analyzing waste that used to exist in last week's now-outdated process
can be its own form of waste.
If you do identify an improvement idea unrelated to the current Obstacle of focus (maybe ideas for safety, or quality...???) then rather than following every rabbit trail, your Coach will want to use your 'Potential Future Improvements' template (PotentialFuture.xlsx) to ensure that all improvement ideas are captured for future consideration.
Pure Process Analysis
If you are doing pure process analysis, (not combined with a waste walk), then by far your most popular tool will be your 'Process Analysis' template (Analysis.xlsx) where you can easily hide and unhide popular lean metrics and easily add unlimited rows for the Key Performance Indictors (KPI's) that are most important to measure, analyze, and improve for your unique process.
How to use your
Process Analysis template
also known as Results Metrics
Before getting started
We are assuming that you have already properly launched your team, and performed all of your usual leadership responsibilities using your lean leadership tools.
Your leaders might have already personalized your master template, so that (using a single master template), you can simply choose which type of process you are analyzing.
Excel Ribbon bar > Systems2win tab > Translations & Substitutions > Select Translations and Substitute Phrases for THIS Template > Apply User Substitute Phrases
Use the dropdown list to choose the types of processes defined by your leaders.
For example, your leaders might have defined different things to analyze for an Office process vs. a Production process.
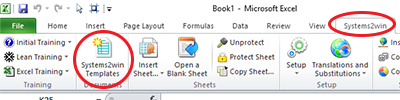
Find and open your template
Find and open your Process Analysis template
(Analysis.xlsx)
in the same way that you find and open your other 150+ Systems2win templates.
If you don't yet own a license,
you can download your free trial now.
Save your working document
following the usual document storage and naming conventions established by your leaders
Open a Blank Sheet
When you're ready to start doing your own real work...
click the button to 'Open a Blank Sheet'
Excel Ribbon bar > Systems2win tab > Open a Blank Sheet
This blank sheet is where you will do your real work
(not on the Sample sheet — which gives you sample data that is extremely helpful for learning how to use your new tool, but is the wrong place to do your real work)
Rename your new sheet.
Or... Insert Sheet
As an alternative to opening a stand-alone document (as instructed above),
you also have the option to Insert Sheet into any other Excel workbook.
If English is not your preferred language
Switch to your language, just like every Systems2win Excel template.
Now your team is ready to get started...
Enter header data
Process Name
Brief description of the process or value stream being analyzed.
Strategic Challenge
What stretch goal is this team currently working toward?
What Strategic Challenge is this team working on to support the current Strategic Plan?
Header Data
Most commonly, you will enter the Revised Date and Auditor name.
But it's your document. You can enter any header data you want.
User-Defined header data
You can optionally unhide the User-Defined header row, and can optionally copy it, for unlimited rows of header data.
Date
Enter Start Date.
Target Date is optional.
Tip: To change date format - Right-click > Format Cells > Number tab
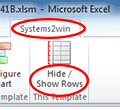
Hide or Show Rows
Use the Hide / Show Rows feature
to instantly hide or show only those rows that you choose to analyze different types of processes.
For example, you might use different criteria to analyze a Lean Manufacturing process vs. a Lean Office process.
How do you use the Hide/Show Rows feature?
Watch the video
Video: Hide or Show Rows
When you click the 'Hide/Show Rows' button in the Systems2win menu
you can choose to either Show All Rows, or to show only those rows that contain your chosen Show Rows code
You can define unlimited user-defined Show Rows codes
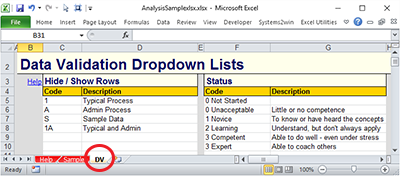
All dropdown lists (on any Systems2win template) are defined on the DV sheet.
Tip: Although it does support multi-character codes, it is usually wise to use single character codes.
The default codes are:
1 = Typical process
A = Admin or Office Process
S = Sample
(to filter the data on the Sample sheet)
You can keep these defaults or replace them with your own,
and you can optionally add an unlimited number of your own user-defined codes for any types of processes that are unique to your industry, organization, or process
Perhaps for the different types of widgets or services that you produce.
Perhaps for engineering, accounting, IT, and every other unique type of support group or department.
Perhaps for two Regional Managers that like to analyze the same process 2 different ways.
Unlike most Systems2win templates...
There is no pop-up help for any of the row headers
Why? We left out the pop-up help so that you can easily personalize your template
Easily replacing any line item with your own preferred User Substitute Phrases without the annoyance of lingering pop-up help that no longer matches your new process analysis criterion
Rather than pop-up help, you can visit this training web page to find help for each of the pre-defined rows of potential Process Analysis Criteria.
Help for each row of potential
Process Analysis Criteria
Usually, you will hide rows for all but your chosen 6-12 Process Analysis Criteria.
This section of this training page provides help and training for each of the potential Process Design Objectives that you might choose to keep unhidden.
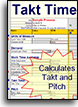
Work Time Available
Notice in the sample illustration that in the Links column, the Author of this document has provided a Link Icon
that users can click to open the Excel Takt Time Calculator for this process.
That's a really smart idea for you to also do for your process, because the Takt Time Calculator provides the source data details for many of the line items in this section for 'Work Time Available'.
Also notice the folder link above the 'Links' column header.
That's also a smart thing to provide for the users of your document.
And then provide personal mentoring to train your users that they can simply click that Link Icon to instantly open the folder that contains most (or all) of the other documents related to this same process.
If it has been a while since you last reviewed the training for Document Storage and Naming Conventions to prevent broken hyperlinks, you might want to review it again.
Shifts, Overtime, Number of Workers
Almost everyone already knows the definitions of these common terms...
so we're going to focus our attention on those Process Design Objectives that might have some confusion.
Smallest Possible Staff
You might link to any one of several Systems2win templates that have this calculation, including:
- your Value Stream Mapping template (VSM.xlsx)
- your Swim Lane Cross Functional Flowchart (FunctionalFlow.xlsx)
- your Standard Work template (StdWork.xlsx)
which has a video that explains this calculation, along with several other useful formulas for Standard Work Shift Cycle Analysis
Utilization %
What percent of time are your workers working?
Again, you might link to one of the source documents that has this calculation.
Time Per Change Over, and Change Over Time per Day
See training for Change Overs, and SMED Quick Change Over Setup Reduction
Planned Downtime and Unplanned Downtime
Most commonly, you will simply link to your Takt Time Calculation to explain these numbers.
If you are doing OEE analysis for this process, then you might link to your OEE source document.
OEE Overall Equipment Effectiveness
See training for OEE Overall Equipment Effectiveness.
Absenteeism
How often do workers simply not show up for work?
Work Time Available
Again, the source document is usually your Takt Time Calculator.
User-Defined Metrics
It's Excel.
Use everything you know about familiar Microsoft Excel to measure anything.
Perhaps add your own user-defined metrics
In addition to all of the pre-defined popular lean metrics (listed above) you can also easily add your own user-defined metrics.
Option 1) Use the blank rows
Between each major section, there is a blank row.
You can copy that blank row, and use everything you know about familiar Microsoft Excel to add unlimited rows of your own user-defined metrics to measure anything that is important to the success of your unique process.
Option 2) Replace a pre-defined metric with your own
The worksheet is not protected.
If you are the Author of your own working document, and you want to replace a pre-defined metric with your own, then you can simply overwrite that VLOOKUP formula with your own text
the same way that you can personalize text in any Systems2win template
If you are a Process Improvement Team Leader, and you want to personalize your master template for your own metrics unique to your industry or organization, then you can do that the same way that you personalize any Systems2win template.
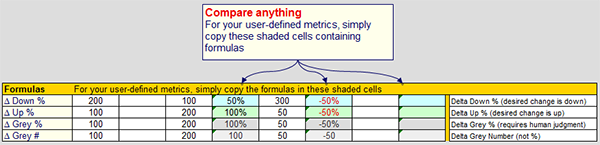
Copy the shaded cells
It is real easy to get your formulas right.
Simply copy the shaded cells beneath the Print Area for:
- Delta Down % — desired direction of change is down
- Delta Up % — desired direction of change is up
- Delta Grey % — requires human judgment to decide whether change in either direction is good or bad
- Delta Grey # — rather than a percent, it calculates the change as a raw number
Tip: If conditional formatting doesn't correctly show the color red immediately in a newly copied cell, you might need to manually recalculate. (CTRL+SHIFT+ALT+F9)
Tip: Formulas deliver a blank result if either of the numbers is zero.
Why? Because some metrics should treat the zero as a 1, and others shouldn't.
The situations are too inconsistent, so it just delivers a blank result.
Of course, you can use everything you know about Excel to write your own formulas
(but might your time be better spent improving your next process?)
Demand
Demand per Shift
How many do you need to deliver?
Demand Unit of Measure
In the pink double border field, enter the unit of measure that gets delivered to your end customer.
And notice that the Unit of Measure instantly changes for several other related rows.
Takt Time
See online training for Takt Time.
Perhaps use a Link Icon to link to a related document to explain your Takt Time calculation.
When you enter the unit of measure for Takt Time, notice that the unit of measure also instantly changes for several other related rows.
Target Cycle Time
If you are one of the (many) lean practitioners that makes no distinction between Takt Time, Operational Takt Time, and Target Cycle Time... then simply hide this row.
But be sure to have a conversation with the users of your document, to ensure that everyone has the same understanding and way of calculating 'Takt Time' the same way you do.
User-Defined
See the training section above to learn how to add unlimited rows of your own user-defined metrics.
Process Metrics
One of the foundational Lean Principles is for management and lean leaders to focus on both:
- Bottom line Results
- And the details of the Processes that produce those results
In this section, you focus on the Process,
and in the next section, you focus on Process Outputs.

Cycle Time
We put Cycle Time at the top of the Process section just so that it would be nearby for easy comparison to Target Cycle Time
Process Flow
Notice that there are no numbers.
Use a Link Icon to link to your preferred types of flowcharts to graphically illustrate how flow changes over time as a result of your team's process improvement successes.
As you learned in the online training for a Typical Lean Journey to Lean Transformation
the single most important focus and objective is usually to design, maintain, and continuously improve Lean Flow.
If you're not focused on flow, then you're not on a Lean Journey
so it should be pretty rare to hide this row.
Why is flow so important?
Lead Time, Process Time, and Activity Ratio
The bread and butter most common lean metrics.
If popular terms are not yet completely familiar to you,
then you might want to schedule a Sunday morning with a cup of coffee to wander around this web site...
perhaps starting with the Lean Glossary
Value Add Time, Value Add & of Time, and Value Add Steps
Perhaps use Link Icons to link to related documents where you perform Value Add Analysis
Distance Traveled
For either or both — the item being process, and/or the human walk paths.
Perhaps link to your Supply Chain Map or your Layout Diagram.
Inventory — Standard Work In Process
Where do things pile up?
See training for Standard WIP
Perhaps link to your Value Stream Map and/or Layout Diagram.
Batch Size, Pulse Batch Size, and Pitch Pulse
Sometimes your Change Over Batch Size is the same as your Pulse Batch Size.
Sometimes not. Learn more about Pitch Pulse.
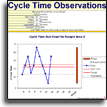
Stability Analysis
How stable is your process?
How much Range of variability is there between one cycle and another?
The right tool for Stability Analysis is your Cycle Time Observation template.
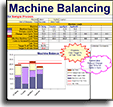
Effective Machine Time
If any Machine Cycle Time is getting too close for comfort to your Target Cycle Time, then it's time to pull out your Machine Balancing template.
Safety Warnings and Accidents
Don't really need explanation, do they?
User-Defined Metrics
This Process section is the most likely place to add your own user-defined metrics, following the instructions already covered above.
Process Outputs
Process Capacity
Perhaps use a Link Icon to link to a related document that calculates capacity:
- your Value Stream Mapping template (VSM.xlsx)
- your Swim Lane Cross Functional Flowchart (FunctionalFlow.xlsx)
- your Standard Work template (StdWork.xlsx)
Guaranteed Turnaround Time
Guaranteed Turnaround Time is a very useful metric for Lean Office and Administration.
In Lean Manufacturing, it is better known as Every Part Every Interval.
Output
Remember... your lean objective is throughput, not output.
(Inventory that is sold, not just produced)
Good Units Produced, Defects, Rejects
See training for OEE Overall Equipment Effectiveness.
These are the terms that you are most likely to personalize with your own industry-specific terminology.
You might produce 'Happy Patients' rather than 'Good Units'.
Defects might be 'blemishes', 'dents', or other 'imperfections'.
Rejects might be 'scrap'.
Your lean objective
is throughput, not output
(Inventory that is sold,
not just produced)
Rework and % Complete and Accurate
Choose one.
Rework = How often did it require fixing?
% Complete and Accurate = How often did we get it right? (without need for fixing)
Returns, Finished Goods Inventory
Need no explanation
Cost per Unit
If your management wants you to measure cost per unit, then your management really needs to learn how to use your Standard Work template and your Standard Work Estimates template because otherwise they are asking you for guesstimates that you are going to pull out of thin air
Lean Management Systems
Improvement Ideas
The ultimate objective of every lean tool, lean method, and lean principle is to stimulate human thinking.
See online training for Hansei
Improvement Events
Improvement events might include kaizen events, value stream mapping events, as well as A3 projects, six sigma projects, and all manner of continuous improvement.
All that matters is that you define your own Operational Definitions of what qualifies as an 'Improvement Event' within your organization.

Leadership progress
There are several rows that all use the same dropdown list choices to evaluate the competence and progress of different aspects of lean leadership.
(and yes, of course you can define your own dropdown lists evaluation choices...
the same way that you can personalize any dropdown lists in any Systems2win template)
Click the 'Help' links associated with each row to learn more about each.
5S Assessment
Enter the Overall Score from the 'Scorecard' sheet of your 5S Assessment template (5S.xlsx)
And use a Link Icon to link to the source document.
Standard Work Audit and Leader Standard Work
Enter the number of 'Misses' from your Standard Work Audit form (StdWkAudit.xlsx) and Leader Standard Work form (LSW.xlxs)
And link to the source documents, to easily drill down to see the details of suggested countermeasures.
PDCA Coaching
How many PDCA Coaching sessions?
to systematically coach the owner of this process to systematically improve the process
measurably toward realization of the current Strategic Challenge
TWI Training
How many TWI training sessions?
to systematically train workers to prove that they truly understand and are competent with the skill you are teaching them
(rather than just nodding their heads, and then doing things their own way tomorrow)
Team Training
How many Team Training sessions?
to kick off a newly launched team or to prepare a seasoned team to reach new heights
Cross Training
How many tasks have been cross trained?
Link to your Training and Skills Matrix (TrainingMatrix.xlsx)
Lean Assessment
Enter the Overall Score from the 'Scorecard' sheet of your Lean Assessment template (Assess.xlsx)
And use a Link Icon to link to the source document.
Okay... now that you have used the Hide/Show Rows button to show only those (usually 6-12) Process Design Objectives that you have chosen to measure for your unique process...
let's finish the instructions for...
How to use your
Process Analysis template
to measurably improve your process
Enter Start and Target Measures
For each row that you have chosen to keep unhidden, enter:
Unit of Measure
When you enter your Unit of Measure in the pink double-border cells for 'Demand' and 'Takt Time', notice that the Unit of Measure instantly changes for several other related rows.
Start
Enter the data that you observe as of the Start date.
Target
What target goal is this team working toward for each of your selected rows?
Think, Ponder, Reflect
The most important phase of every process improvement effort is to pause long enough to think, ponder, and reflect.
(perhaps using your Hansei questions to stimulate Lean Thinking)
Consider Collateral Benefits
In the text boxes at the bottom of your document, also consider subjectively measured Collateral Benefits such as improved employee morale, reduced costs associated with employee turnover, reduced environmental impacts, improved safety…
Tip: See if you can find creative ways to measure Collateral Benefits
using objective measurable
numbers, rather than just subjective speculation.
Complete your Executive Briefing
You should now be ready to make your first Presentation of Results to your senior managers, executives, and other stakeholders ideally also using a few of your other templates to deliver a more impressive Executive Briefing.
Do it. Improve the Process
The only things your team has accomplished so far is:
- Team launch
- Training
- Choosing where to focus your attention
At this point, your process has not yet been improved.
So go... do it...
Improve your process...
Potentially using any combination of the many lean tools and methods in your arsenal, and remembering that the ultimate purpose of every one of those tools and methods is to stimulate creative human thinking. (hansei)
Can we wait to start
this project?
I haven't finished
making my tools.
Perform your first Periodic Audit
On your agreed upon first audit date, (usually 30 days)...
your team representative(s) meet with your Auditor(s) to review how you're coming with your goals.
Perform as many Audits as it takes
If your Strategic Challenge is a well-chosen stretch goal, then you probably won't accomplish every Target objective within just 30 days.
Keep scheduling additional Audits until your Target objectives are reached (and stabilized) and then start the cycle again, by choosing another Strategic Challenge.
Every time that you schedule another Audit, simply copy and paste another pair of columns for another audit date.
Your Process Analysis Excel template can support an unlimited number of audit dates.
Tip: It's a good idea to keep a blank pair of rows available to easily copy.
How to personalize your
Process Analysis template
Each user of this template can personalize their working document
using every thing you know about familiar Microsoft Excel.
Your leaders can personalize your Process Analysis master template
to pre-define different types of process analysis for an unlimited number of different types of processes
Most commonly, the things that you commonly analyze for a Lean Office or Administrative process are often somewhat different from the things that you commonly analyze for a Lean Manufacturing process.
And if you're in Lean Healthcare, then you already know how your people's eyes glaze over
until you sanitize your forms to remove any terminology that might have any association with an automobile.
More creatively, your leaders can pre-defined suggested standard process analysis patterns for any types of processes that are unique to your industry or organization
Perhaps for the different types of oil and gas that you produce.
Perhaps for medical procedures vs. medical supply room processes.
Perhaps for two Regional Managers that like to analyze the same process 2 different ways.
How?
The same way that you personalize every one of your other Systems2win Excel templates.
Pop Up Help
The one thing that is different about your Process Analysis template is that there is no pre-defined pop-up help for any of the process analysis line items.
Why?
We left out the pop-up help so that you can easily replace any line item with your own preferred User Substitute Phrases
without the annoyance of lingering pop-up help that no longer matches your new process analysis criterion
So how do our users find help?
By coming to this online training page
where we have provided help for every line item — in a way that can be translated (unlike pop-up help)
Can we add our own user-defined pop-up help?
Sure. The same way that you can for every one of your Systems2win Excel templates.
In a way that your user-defined pop-up help gets automatically found and transferred
to your new master template every time that you upgrade
Most of your personalizations will be automatically found and transferred each time you upgrade.
The one thing that you will probably need to manually copy and paste to your new master template is your list of user-defined codes in the Hide/Show Rows column.
Almost everything else will be automatically found and transferred, including:
- Your user-defined dropdown lists
- Your substitute phrases for your own user-defined Process Analysis Criteria
When you personalize your Systems2win templates
then over the years, your templates become more and more...
yours
Own these Process Analysis tools
to empower every team member
Contents
Wouldn't it be nice to work in a place that has better tools and systems?
Own Yours Now
If your organization has
not yet provided a license,
own yours now
Training and Coaching
Consider Training and Coaching to support your teams to succeed
Training to get you started.
Tools you won't outgrow.
Schedule a Conference
Schedule a conference
to discuss your challenges
with an experienced lean advisor
150+ Templates
Try Some
Own Them All
Download Trial Now
Get a dozen trial templates,
and another dozen free gifts
@@@ Better conversion rate
if call to action is for a specific tool, and shows the image
Try It
Try this template
along with a couple dozen more
process improvement tools
Calls to Action Botttom

Related Topics
Related Topics section WITHOUT TESTIMONIALS
Replace this paragraph with menu library item for topics related to this video
Training and Coaching
Consider Training and Coaching to support your teams to succeed
Training to get you started.
Tools you won't outgrow.
Schedule a Conference
Schedule a conference
to discuss your challenges
with an experienced lean advisor