
Process Improvement Tools.
Standard Work.
Work Instructions.
Flow Chart templates.
Swim Lane Cross Functional Flowchart.
Value Stream Mapping.
Lean tools.
Yamazumi Chart template.
Time Study templates.
DMAIC tools.
Quality Improvement tools.
House of Quality QFD.
FMEA Risk Reduction.
Root Cause Analysis tools.
Problem Solving tools.
OEE.
Preventive Maintenance.
Skip to main content


Sticky Notes


7 Types of Sticky Notes


Installation and Setup
Installation - Each User. Installation - Multi-user. Language Translations. Personalize Your Templates.Systems2win Training.
Quick Start Initial Training. New User Training. Training Matrix. Systems2win Leadership. Training Classes.Lean Training
Lean Training and Coaching. Lean Principles. Muda 8 Wastes. Goal - Lean Flow. Roadmap - Lean Journey. Value Stream Mapping. Standard Work. Hansei Lean Thinking. Lean Dictionary. Online Lean Training. Lean Leadership.Microsoft Office Training
Excel Training. Excel Drawings (without Visio). Excel Charts. Word Training. PDF Training. Document Storage and Naming.Support
Support.Value Stream Map
What is a Value Stream Map?
A Value Stream Map is a special type of flow chart used during the process of value stream mapping to depict and improve
1) the flow of "the thing being transformed"
which could be inventory, a medical patient, paperwork, electronic information, or anything in any segment of any value stream
2) the information needed to control the flow of the thing being transformed
Sections of a Value Stream Map
Sections of Value Stream Map
Section 0 : Hide/Show Rows
(to the left of the Print Area)
Watch this video to learn now to use Hide/Show Rows
to quickly hide or show different levels of detail for different target audiences
Section 1: Headers & Default Data
Click any row header to get pop-up help.
When you are ready to start your value stream map, the first step is to populate your default data and units of measure in the pink double-border cells, (which will then automatically calculate Takt Time, Work Time Available, Pitch Pulse, and more)
Section 2: Information Flow
The flow of the information that drives the flow of the thing being transformed
If your value stream map does not have this section, it's not a value stream map.
Section 3: Critical Path Flow of the thing being transformed
The "thing being transformed" might be a product, a service, a patient...
All of your most important Critical Path Continuous Flow Process Boxes should be in this 'Critical Path' tier.
You can use 'Hide/Show Rows' to unhide optional tiers for Pre-Production, Post-Production, and Simultaneous Processes, but this Critical Path tier should never be hidden.
Section 4: Lean Metrics — within each process
At the extreme minimum, at least measure 'Process Time'.
Optionally unhide many more metrics for Value Stream Analysis.
Section 5: Lean Metrics — between processes
At the extreme minimum, at least measure 'Queue Time'.
Optionally unhide additional metrics.
Section 6: Simultaneous processes
Optionally unhide one or more tiers of Simultaneous Processes
Section 7: Value Stream Totals
Optionally unhide rows for Time Sum Line analysis.
Total Lead Time, Process Time, Value Add Time, Cycle Time, Activity Ratio, and more.
Section 8: Old State Comparison
Click the button to Import Old State Comparison to easily analyze:"How much better is our proposed state compared to our current state"?
More Sections of a Value Stream Map
There are two new sections that you can optionally unhide...
Pre and Post-Production Processes
To optionally include value stream segments that happen before or after the primary value stream,
you can optionally unhide Pre and Post-Production sections for Multi-layered Value Stream Mapping
Examples: engineering, quotes, sales order processing, patient admission...
Example of pre-production — for a value stream that sometimes starts with a Quote process
Value Stream Analysis
Below Section 7 Value Stream Totals, you can optionally unhide another section for Value Stream Analysis
Sample Value Stream Analysis Example
What should NEVER be on
any Value Stream Map
Too many or too few Continuous Flow Process Boxes
If you have more than 15-24 Continuous Flow Process Boxes, then either:
- You haven't yet come to a full understanding of the definition of a Continuous Flow Process Box.
- Or you need to bend that definition — in order to simplify your map by removing some of the less important Process Boxes (even if they do fit the definition)
If you have fewer than 4-5 Continuous Flow Process Boxes, then either
- Bend the definition in order to show even minor pauses in process flow
- Or expand your scope connecting islands of flow further upstream or downstream from your currently chosen value stream segment
Swim lanes
A Value Stream Map is not a Swim Lane Functional Flow Chart.
They have very different purposes, and a value stream map should never have swim lames.
Decision diamond
A value stream map should never contain a decision diamond.
A current state map should depict one (and only one) very narrowly-defined scenario. No split streams.
A future state map should also depict a narrowly-defined scenario, but there are valid reasons for wanting to depict split streams on one map, and our online training teaches several acceptable ways to handle divergent flows, none of which involves a decision diamond.
What should ALWAYS be on
every Value Stream Map
Continuous Flow Process Boxes
Continuous Flow Process Boxes are very different from process boxes on a regular flow chart.
Make sure that everyone on your team fully understand the definition, and uses your Continuous Flow Process Boxes correctly.
Metrics
Every value stream map should measure key metrics for your value stream,not just draw it.
At the extreme minimum, your team should measure at least the most basic two metrics:
- Process Time
- Lead Time
See training for Value Stream Analysis, and dictionary of lean terms.
Information Flow
Toyota doesn't even use the phrase "Value Stream Map".
That phrase was coined by consultants that studied Toyota.
Toyota uses a "Materials and Information Flow Diagram".
If your self-designed tool depicts only the flow of "the thing being transformed", and does not show the flow of the information that controls that flow, then you really shouldn't call your tool a "value stream map".
You invented your own tool, so you should invent your own name for it.
The Art of Value Stream Mapping
There is a lot of art that goes along with the science of value stream mapping.
A skilled an experienced lean practitioner will often invent new ways of illustrating unique conditions, and will often invent new metrics to measure and control unique variables.
And one of the foundations of lean is to encourage practitioners to start with existing tools and methods, and then modify them to invent new ways to strive toward the never-changing lean principles in ever-changing ways.
But if your value stream map is missing something that should always be on any value stream map, or contains something that should never be on any value stream map, then:
- Maybe you've chosen the wrong tool. Maybe one of the other types of flowcharts might be a better choice.
- Maybe you might not have yet reached a complete understanding of the foundational intended purposes of a value stream map.
- Maybe you're using the tool in such a unique way
that it might be appropriate to simply remove the label 'Value Stream Map', or change it to something more accurate, like 'Process Flow Map'.
The Poetry of Value Stream Mapping
The types of poems are many
each with its own style upon it
But what of a beautiful free verse poem
whose author has named it a sonnet?
The types of flowcharts are many
each with its own special gifts
If you label your flowchart a "Value Stream Map"
then please, just make sure that it is
Sticky Notes
for Value Stream Mapping
Because we sell value stream mapping software, you would think that we would be biased against sticky notes, right?
And yet our training for how to do value stream mapping suggests starting with sticky notes.
Why Sticky Notes for Value Stream Mapping?
We suggest starting with sticky notes in order to prevent technology from getting in the way of dialog.
The facilitator can focus on listening and facilitating, and every team member can pick up a pen or a post-it.
We list very strong reasons why to use value stream mapping for your future state, and yet strongly believe that your current state should start with sticky notes.
The problem with Sticky Notes for Value Stream Mapping
While it is true that value stream mapping software might sometimes have too much structure, the opposite is also true...
sticky notes have too little.
If you do a quick Internet search for images of a 'value stream map', you will find that more than half of the images labeled ' value stream map' are actually missing one or more elements that are absolutely essential.
In other words, they are not truly a value stream map.
It seems that when faced with a blank sheet of butcher paper, many teams (and even high-priced outside facilitators) often forget the fundamental elements of a value stream map, and start inventing their own home-grown ways of doing things.
Any Value Stream Map that you create with sticky notes should have the same sections, symbols, and math as the same Value Stream Map that you (later) clean up with your value stream mapping software.
Relationship between sticky notes and electronic
The animated image below shows an identical value stream map:
- Using sticky notes
- Using your Systems2win value stream mapping template
The same value stream map using both sticky notes and software
(animation rotates images every 10 seconds)
7 Types of Sticky Notes
for Value Stream Mapping
If you are the Facilitator, then it is your responsibility to ensure that your value stream map (and your shopping list) includes clearly differentiated types of sticky notes for each of the following types of elements:
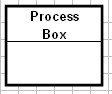
1) Continuous Flow Process Box
Function:
Depicts the flow of the thing being transformed.
It is very important that every team members understands the difference between:
1) a (similar-looking) 'Process' box in a traditional flowchart
2) a Continuous Flow Process Box for a value stream map
Shape and size of sticky note:
Large square or rectangle.
Each of these 7 types of sticky notes should have a unique color.
Always:
Write the name of the Process in the upper half of the box.
Usually a one or two word description. Some prefer verb / noun.
Variations:
You might draw operators and/or U-shaped cells.
You might invent your own ways to identify the Pacemaker Process, Constraints, Shared Processes, Repeat Processes, Outside Processes, Periodic Processing Cells, and/or Guaranteed Turnaround Time.
Yes, your Systems2win template has clearly-defined systems for how to handle each of these common value stream mapping challenges — with clearly documented online training.
One of the (many) compromises of the (supposedly simple) approach of using sticky notes for value stream mapping is that each team needs to invent their own systems for how to handle each of these common circumstances, and then invent their own ways to train every one of their stakeholders to understand the systems they invent.
2) Lean Metrics Data
Function:
Show data observed or calculated for each Process Box.
Show data observed or calculated between processes.
Shape and size of sticky note:
Unobtrusive color, such as cream, yellow, or white.
Sticky notes with pre-drawn lines are best — to visually separate rows of data.
Always:
Always observe Process Time
Always record the number of Operators (if more than one)
Always observe Queue Time (between processes)
If this is an office or service value stream, always record Percent Complete and Accurate.
Variations:
You can either use a separate sticky note for data between each process, or you can enter that "between" data along with the process before the delay.
If you are only gathering a tiny amount of data, then you might even enter your Lean Metrics Data at the bottom of the same sticky note that serves as your Continuous Flow Process Box.
You might observe or calculate Standard Work In Process (WIP) Inventory, and/or any other lean metrics for Value Stream Analysis.
Tip: Let your value stream mapping template do the more math-intensive calculations for you.
On each sticky note, be sure to include labels for each type of data that you observe or calculate.
Your people can't simply click for pop-up help and/or links to on-line training like they can with your value stream mapping template, so it is especially important to ensure that every team member and stakeholder truly understands definitions, formulas, and examples for each metric.
You might assume that everyone knows what 'C/T' means, but maybe some stakeholders don't.
3) Delays
Function:
Highlight delays between processes and delays in information flow.
Shape and size of sticky note:
Smaller. Unique obnoxious color that really stands out.
Always:
Describe the Type of delay (for example: inventory, queue, buffer, FIFO Lane, Supermarket...)
Variations:
To make delays stand out even more, perhaps rotate the square sticky note so that it looks like a diamond, or cut it into the classic triangle shape (that is commonly used for both Inventory and Queue delays).
Perhaps draw the symbol for Inventory, FIFO Lane, Supermarket, etc.
Or use special sticky notes for special types of delays.
How long is the typical delay? (for example: 2 hours, 2 days, 2 weeks...)
Queue time is usually already recorded (as instructed above), but is so important that it is often re-stated.
4) Transportation
Function:
Show when and how the thing being transformed gets transported.
Shape and size of sticky note:
Smaller. Color might be different, or same as sticky notes for Delay.
Some people use sticky notes that look like a big Arrow (to show motion).
Always:
Describe (or draw) the mode of transportation (for example: Truck, Train, Ship, Forklift...)
Usually:
Frequency (for example: twice a week, daily, every other Wednesday, expedite as needed...)
5) Information Flow
Function:
Describe the flow of information that drives the flow of the thing being transformed.
Shape and size of sticky note:
Small square. Unique color..
Always:
Always include on every sticky note for Information Flow:
- Type of information
(for example: Sales Order, Purchase Order, Sales Confirmation...) - Mode of information transfer (for example: verbal, phone, email, EDI...)
- Frequency (for example: weekly, daily, usually every Thursday...)
Variations:
For Customer/Supplier, perhaps use a special color sticky note, and perhaps draw or cut out the jagged shaped top.
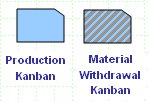
6) Kanbans
Function:
Kanbans are a special type of information flow.
See online training to learn about the various types of kanbans, and how to use your Kanban Calculator (KanbanCalculator.xlsx)
Shapes and sizes of sticky notes: Use scissors to cut blue sticky notes into the shapes of the various kanbans.
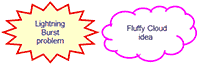
7) Problem Bursts and Idea Clouds
Function:
Burst: Highlight barriers to flow, and other problems that need attention.
Cloud: Highlight ideas for countermeasures to problems.
Learn more about bursts and clouds.
Shape and size of sticky note:
Ideally shaped similar to a burst or cloud
(or just draw the burst or cloud on a rectangular sticky note)
Use (very) unique colors.
Large enough to write a sentence if needed.
(you can always use a scissors to make a smaller sticky note)
Variations:
Some people identify minor barriers to flow on the same (already crowded) sticky note for the Continuous Flow Process Box — perhaps using red ink.
Major barriers to flow should always be highlighted using a burst.
If your value stream map does not have all 7 of the above types of sticky notes, then double check to ensure that you didn't inadvertently skip over one of the fundamental steps of the value stream mapping process.
Background paper & markers
Option 1) A roll of butcher paper (most popular)
Advantages: Easy to expand (tape a new segment), or reduce (scissors).
Disads: When you roll it up, the sticky notes get unstuck and scrambled.
When you rearrange, anything you drew with a magic marker is permanent.
Option 2) 11x17 paper, and draw lines with a pencil
Advantages: Easier to save and transport. Can redraw lines when you rearrange sticky notes.
Disads: Too small for a large team to see. Pencil is almost invisible from a distance.
Option 3) Dry erase board (our suggested best option)
Advantages: Allows you to redraw lines (and your Time Sum Line) when you rearrange sticky notes.
To expand work area, you can add another board, or flexible 60cm x 80 cm SmartSheets.
Disads: No permanent storage.
When you're done, take a snapshot.
which usually isn't a problem for a Current State, which has a very short lifespan
Connector lines and arrows
See online training for the types of connector lines and arrows used in value stream mapping.
Value Stream Map Sticky Note
Don'ts
Don't invent your own symbols and terminology
Why guess at a formula or definition when your lean glossary is always available?
Why guess, when you can always get help for any value stream mapping symbol?
To get help for any shape in any Systems2win template... RIGHT-click the shape > Size and Properties > Alt Text
Don't skip the value stream mapping training
When you search the Internet for images of value stream maps created using sticky notes, it becomes quickly obvious that there are a LOT of teams out there that don't know what they're doing.
Common mistakes:
- Way too much detail. The team obviously skipped the training for the definition of a Process Box.
- The Information Flow section is entirely missing. (and yet they still call it a Value Stream Map)
- It has swim lanes or decision diamonds or home-grown ways to try to show divergent flows.
If your team doesn't skip the value stream mapping training, then you will avoid all of the common mistakes, and your value stream mapping process will yield the benefits that it is designed to deliver and your value stream map will impress and persuade the stakeholders that you will need to impress and persuade in order to convert your proposed plans into daily realities
Don't do value add analysis
How would you feel if someone slapped a red circle on the sticky note that described your job?
How likely would you be to support the efforts of the value stream team from that moment on?
At the high level of a value stream process box, there is almost never a black or white "Non Value Add".
Value Add Analysis is best done within the detailed steps of Standard Work; not at the value stream level.
Don't use a pocket calculator
Use your value stream mapping template to do the math for you.
During a break, quickly plug your 'Current State' numbers into your template, and then transcribe the (correctly calculated) results onto your messy hand-written butcher paper.
Refresh your memory on how to use your value stream mapping template as a Takt Time Calculator.
And you might also use your template to (correctly) calculate your Time Sum Line, and any other value stream analysis metrics that your team chose to measure and analyze.
Don't be a perfectionist
It's just a hand-drawn Current State map.
(which is intended to be repulsive, embarrassing, and messy)
Your team is about to come up with ideas that will change your value stream in big ways.
You will have plenty of time to continuously improve your Future State map(s) when you:
- Use your value stream mapping template to create your Future State map(s).
- Constantly revise and improve your value stream maps
as you respond to feedback and ideas as you Socialize Your Plans, and as you meet regularly to review progress toward the realization of your Value Stream Plan
Return to home training page for how to do value stream mapping
Contents
When to use this tool
in a Typical Lean Journey for Lean Transformation
- Phase 0)
Firefighting - Phase 1) Prepare Your Leadership
- Phase 2) Design Value Streams to Flow
- Phase 3) Analyze, Stabilize, Visualize, and Standardize each process
- Phase 4) Continuously Improve
Road map for a typical
Lean Transformation
The right tools to
Define, Measure, Analyze, Improve, and Control
your value stream maps
(not just draw them)
Tell a Colleague
Training and Coaching
Consider Training and Coaching to support your teams to succeed
Training to get you started.
Tools you won't outgrow.
Schedule a Conference
Schedule a conference
to discuss your challenges
with an experienced lean advisor
150+ Templates
Try Some
Own Them All
Download Trial Now
Get a dozen trial templates,
and another dozen free gifts
@@@ Better conversion rate
if call to action is for a specific tool, and shows the image
Try It
Try this template
along with a couple dozen more
process improvement tools
Calls to Action Botttom

Related Topics
Related Topics section WITHOUT TESTIMONIALS
Replace this paragraph with menu library item for topics related to this video
Training and Coaching
Consider Training and Coaching to support your teams to succeed
Training to get you started.
Tools you won't outgrow.
Schedule a Conference
Schedule a conference
to discuss your challenges
with an experienced lean advisor