
Process Improvement Tools.
Standard Work.
Work Instructions.
Flow Chart templates.
Swim Lane Cross Functional Flowchart.
Value Stream Mapping.
Lean tools.
Yamazumi Chart template.
Time Study templates.
DMAIC tools.
Quality Improvement tools.
House of Quality QFD.
FMEA Risk Reduction.
Root Cause Analysis tools.
Problem Solving tools.
OEE.
Preventive Maintenance.
Skip to main content


Installation and Setup
Installation - Each User. Installation - Multi-user. Language Translations. Personalize Your Templates.Systems2win Training.
Quick Start Initial Training. New User Training. Training Matrix. Systems2win Leadership. Training Classes.Lean Training
Lean Training and Coaching. Lean Principles. Muda 8 Wastes. Goal - Lean Flow. Roadmap - Lean Journey. Value Stream Mapping. Standard Work. Hansei Lean Thinking. Lean Dictionary. Online Lean Training. Lean Leadership.Microsoft Office Training
Excel Training. Excel Drawings (without Visio). Excel Charts. Word Training. PDF Training. Document Storage and Naming.Support
Support.Tree Diagram template
also known as Hierarchy Diagram, Decision Tree Diagram, Why-Why Diagram, How-How Diagram, Decision Tree Template, Critical To Quality Tree, Work Breakdown Structure, or Organization Chart
What is a Tree Diagram?
A tree diagram worksheet starts with a single item that branches (like a tree) into multiple items.
Use it to systematically direct your thinking to increasing levels of specific details
Choose the right type of
Decision Tree template
Generic Tree Diagram template
The generic Tree Diagram template (TreeDiagram.xlsx) can be used to create any of the following variations.
Some variations are popular or unique enough to have their own template.
Tip: If your diagram has complex arrows to illustrate complex relationships between tree elements, then sometimes it is better to use your flowchart template (FlowChart.xlsx)
Critical To Quality Tree Diagram
Variations: Critical to Satisfaction, Critical to Process, Critical to Delivery, Critical to Cost, Critical to Schedule...
The purpose of a 'Critical To' Diagram is to ensure that the product or process characteristics that you measure and control will actually satisfy your customers' desires.
The Critical To Quality Tree Diagram is popular enough to have its own Excel template. (TreeCritical.xlsx)
And your Measurement Assessment Tree Tree Diagram (MeasuresTree.xlsx) can then be used to further refine the stratification of the specific measures for each sub-category of customers and/or delivery channels.
You might also want to use your flowchart template (FlowChart.xlsx) to perform Critical To Quality Analysis, and/or Cost of Quality Analysis.


Why-Why Diagram
also known as Five Whys
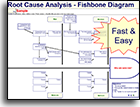
A Why-Why Tree Diagram is an alternative to your Fishbone Diagram template (RootCause.xlsx) to identify root causes of a problem.
Process:
- Clearly define the problem you're seeking to solve
- Ask "why?" this problem happens or might happen.
Write each "cause" in the branch layer right beneath or beside the primary problem. - Treat each cause at this layer as a problem statement for the next layer.
Ask "why?" this problem happens or might happen.
Write each "cause" in the next branch layer — using arrows to show relationships. - Keep going — until each branch terminates with root causes which can then be systematically addressed
(often company policies, systems, or need for training).
How-How Diagram
Variations: Work Breakdown Structure, Job Analysis, or Task Analysis
Similar to Why-Why Diagram, but instead keep asking "How?"
Decision Tree template
Logic Diagram or Decision Tree Diagram template
A sequenced set of alternate paths that lead to a correct decision for what to do in different circumstances.
Often a flowchart is a better tool for creating a logic decision tree.
Process Decision Program Chart
PDPC
To identify potential problems and countermeasures in a complex project plan.
Process:
- Make a high-level tree diagram of your proposed plan of action.
Top cell is the project objective, next tier is main phases, third tier has the most important tasks to accomplish the phases.
- For each third-level task, brainstorm what could go wrong.
Eliminate problems that are not likely to happen, or whose consequences are minor.
Create a fourth tier for the remaining problems.Some tasks might not have significant problems.
Perhaps use a different type of shape for the Problems tier.
- Brainstorm possible countermeasures for each potential problem.
Create a fifth tier for countermeasures.Perhaps use a different type of shape for the Countermeasures tier. (perhaps a cloud shape?)
- Determine the practicality of each countermeasure.
Use criteria such as cost, time, effectiveness, ease...
In the text box for each countermeasure, the first character is either 'X' for impractical, or 'O' for practical.
Bill of Materials
aka Gozinto chart, or Structure Tree Diagram
To visually illustrate the relationship between an item and it's lower-level sub-assemblies, parts, and materials, as well as (optionally) the higher-level item or assembly that this item is a part of.
A Structure Tree is an essential supplement to both a DFMEA and a PFMEA. You will usually use the Insert Sheet button to insert a Flow Chart sheet to illustrate a visual Bill of Materials as a sheet within your FMEA template.
If you use your Tree Diagram template to create your Structure Tree, then you can Link to that supplemental document, copy a picture of it, and/or use the Copy Sheet button to include with your FMEA.
Dendogram
To refine desired product characteristics when doing product design and development.
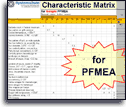
Also see the Characteristic Matrix that is often used when creating a PFMEA.
Breakdown Tree
To illustrate the demographic breakdown of a survey population.
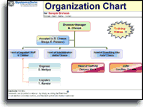
Organization Chart template
also known as Organizational Chart template or Hierarchy Diagram
To define organizational relationships, both formal and informal.
Most people think of an Organization Chart as being different from a Tree Diagram, but they both use the same underlying Excel Hierarchy Diagram, and the instructions for how to use both types of charts are identical.
How to use any
Tree Diagram Worksheet
that features an Excel hierarchy diagram
see the various types of Tree Diagrams (above)
Note: These instructions apply to any Systems2win template that
uses an Excel hierarchy diagram, including:
- the classic Organization Chart template (OrgChart.xlsx)
- the generic Tree Diagram template (TreeDiagram.xlsx)
- the Critical to Quality Tree Diagram template (TreeCritical.xlsx)
- the Measures Assessment Tree Diagram template (MeasuresTree.xlsx)
(to further stratify data beyond the critical-to-quality tree)
Your Decision Tree Diagram templates
come with an entire suite of Process Improvement Tools
to empower every team member to improve every process
Training for how to use your
Tree Diagram template
or any template that features an Excel Hierarchy Chart
Convert the diagram to SmartArt graphic
Double click anywhere on the diagram, and select the radio button to Convert to SmartArt Graphic.
Tip: If you did ANYTHING to the chart before converting it to SmartArt Graphic you will need to delete it, and insert a new one. Insert > SmartArt > Hierarchy
Suggested workflow sequence
to edit any Excel organization chart template or tree diagram template
- Insert and edit primary shapes (without worrying too much about colors, fonts, or other formatting)
- Re-size the work space as needed (rows and columns, Print Area, drawing space...)
- Apply formatting (as the last thing you do)
To change the size of your work space
You might need to do any or all of the following:
- Insert or Unhide the number of underlying rows or columns First look to see if there are any hidden row or columns that can be unhidden. If not, then select entire rows or columns where you want to insert, then right-click > Insert
- Change the Print Area
If you simply Hide & Unhide preformatted rows & columns then you won't need to mess with the Print Area.
In the rare event that you need to change the Print Area — see training for how to change the Print Area.
- Resize the drawing space
To resize the drawing space
Simply drag the corners of the drawing space
To edit text in shapes
You can simply type text in a box...
but it is usually wiser to type your text next to the bullets in the Type Your Text Here window that appears to the side of the diagram whenever you click anywhere on the diagram.
If you foolishly choose to collapse the 'Type Your Text Here' window...
you can toggle the arrow in the middle of the left border of the diagram to bring it back.
The text that you type next to the bullets will also appear in the text boxes.
Measurement Assessment Tree Diagram template
Notice that in the Measures Assessment Tree Diagram template the top text boxes are not actually part of the organization chart diagram.
They are simply text boxes.
Bug: If there is not already any text in one of these top-row text boxes, then there is a bug in Excel 2010 and higher
that won't allow you to add any text so you might need to replace these text boxes with new ones.
Insert > Shapes > Textbox
To add a shape or branch
Right-click a node > Add Shape >
To move or rearrange boxes
In the Type Your Text Here window... right-click > Promote or Demote
Tip: It is a really bad idea to just drag shapes around.
Excel 2010 and higher also has the option to Move Up or Down
which actually means "Move Left" or "Move Right" if that tier is organized horizontally rather than vertically.
Tip: Before using Demote, use Move Up or Down to position the node to the right of the node that you want to Demote beneath.
Caution: It is difficult to move or rearrange the sequence of "co-worker" boxes —
so think ahead to arrange
your upper level co-workers in your desired sequence.
Caution: If you are sure that you are completely done, and will never again run AutoLayout —
then you can toggle
AutoLayout off, which will allow you to move and rearrange boxes.
(But if you ever toggle AutoLayout back on, then all of your moving and rearranging will be lost.)
To resize a box
Resize the entire chart, and the box sizes will adjust automatically.
Or right-click any individual shape(s) > Size and Properties
AutoLayout is a toggle. When you turn it off, you can resize boxes.
Caution: When you toggle AutoLayout back on, any new boxes that you insert will be the same size as the last box that you changed (at the same level). Systems2win recommends waiting to perform all final formatting functions as the very last thing
you do — after all shapes have been added and positioned, and the drawing space has been properly sized.
Layout
e.g. standard org chart format, left-hanging tabs, right-hanging tabs, etc.
With the diagram selected,
select the SmartArt Tools Design tab
(that appears in your Ribbon menu only when a diagram is selected)
then select your preferred type of Layout,
which should almost always be Organization Chart.
Using the Layout dropdown list
in the Create Graphic section of the Design toolbar...
(see illustration)
each branch can have its own layout.
For example, one branch might be left-hanging, and another right-hanging.
Tip: If your tree diagram has complex arrows to illustrate complex relationships between tree elements, then sometimes it is better to use the flowchart template instead.
To format colors, fonts, and shapes
Tip: It is wise to wait until your organization chart is fully laid out before applying formatting to individual shapes
With the diagram selected, select the SmartArt Tools Design tab and/or Format tab
(that appears in your Ribbon menu only when a diagram is selected)
then have fun trying out all kinds of different styles and formats.
You can also right-click any individual shape(s) > Format Shape
To format connecting lines
Right-click any individual line(s) > Size and Properties
Tip: If your tree diagram has complex arrows to illustrate complex relationships between tree elements, then...
- you can add extra lines and arrows as the very last thing you do — right before saving and/or printing
- or use the flowchart template instead
Text boxes, pictures, and AutoShapes
within the drawing space
Tip: Keep these elements off to the side of your drawing space until you are ready to do your final formatting.
Feedback form
If you identify any other tips that you feel would be helpful to include in this documentation,
please use our Feedback Form
I have a question that's not answered here
Try these other resources:
- Tips for Microsoft Office Drawings
- Tips for working with Systems2win Excel Worksheets
- Systems2win Portal training
- Contact Systems2win to get answers to your questions, or to share your ideas for how to make a template better
No, we're not going to
buy you any tools...
but we don't want any excuses when those deadlines are due
Own Yours Now
If your organization has
not yet provided a license,
own yours now
Training and Coaching
Consider Training and Coaching to support your teams to succeed
Schedule a Conference
Schedule a conference
to discuss your challenges
with an experienced lean advisor
150+ Templates
Try Some
Own Them All
Download Trial Now
Get a dozen trial templates,
and another dozen free gifts
@@@ Better conversion rate
if call to action is for a specific tool, and shows the image
Try It
Try this template
along with a couple dozen more
process improvement tools
Calls to Action Botttom

Related Topics
Related Topics section WITHOUT TESTIMONIALS
Replace this paragraph with menu library item for topics related to this video
Training and Coaching
Consider Training and Coaching to support your teams to succeed
Training to get you started.
Tools you won't outgrow.
Schedule a Conference
Schedule a conference
to discuss your challenges
with an experienced lean advisor