
Process Improvement Tools.
Standard Work.
Work Instructions.
Flow Chart templates.
Swim Lane Cross Functional Flowchart.
Value Stream Mapping.
Lean tools.
Yamazumi Chart template.
Time Study templates.
DMAIC tools.
Quality Improvement tools.
House of Quality QFD.
FMEA Risk Reduction.
Root Cause Analysis tools.
Problem Solving tools.
OEE.
Preventive Maintenance.
Skip to main content


Installation and Setup
Installation - Each User. Installation - Multi-user. Language Translations. Personalize Your Templates.Systems2win Training.
Quick Start Initial Training. New User Training. Training Matrix. Systems2win Leadership. Training Classes.Lean Training
Lean Training and Coaching. Lean Principles. Muda 8 Wastes. Goal - Lean Flow. Roadmap - Lean Journey. Value Stream Mapping. Standard Work. Hansei Lean Thinking. Lean Dictionary. Online Lean Training. Lean Leadership.Microsoft Office Training
Excel Training. Excel Drawings (without Visio). Excel Charts. Word Training. PDF Training. Document Storage and Naming.Support
Support.Lean Dictionary
Lean Glossary for Process Improvement
Definitions, formulas, examples, training, videos, and Excel templates
to (really) learn and understand lean manufacturing terms for Lean process improvement.
Lean Dictionary
- Customer Demand
- Work Time Available
- Out of Cycle Work
- Lead Time
- Queue Time
- Process Lead Time
- Process Time
- Activity Ratio
- Value Add Time
- Machine Time
- Cycle Time
- Effective Cycle Time
- Takt Time
- Target Cycle Time
- Takt Image
- Pitch Pulse
- Pulse Batch Size vs.
Change Over Batch Size - Guaranteed Turnaround Time
- Standard Work In Process Inventory
- Percent Complete & Accurate
- More Lean Glossary terms
Tips
To find keywords...
use CTRL+F
To learn better and faster...
keep a copy of your Excel template open in another window so you can play with actual data until you truly understand each definition and formula in this lean dictionary
To better understand the 'bigger picture' context
for the terms in this lean glossary, see the online training and videos for a Roadmap for a typical Lean Transformation
Lean Manufacturing Terms
The lean dictionary terms on this page have been phrased to be relevant for ANY lean office, lean healthcare, or lean service environment...
(not just lean manufacturing)

These are the exact formulas and definitions used in your Excel templates.
Lean Dictionary
Customer Demand
also known as 'the thing being transformed'
Definition
What the customer is buying. What you are transforming.
Examples
In a manufacturing, distribution, or retail environment, the thing is usually a physical product.
In an office, service, non-profit, or government environment, the thing might be a form.
Units of Measure
Customer Demand Unit of Measure should be the most common unit of measure for the end product that is delivered to the customer for the entire value stream.
Examples: Cases or six-packs of soda (rather than bottles).
Units or cases, rather than pallets. (unless your customer usually buys pallets)
Customer Demand should be expressed in the same time Unit of Measure as Work Time Available.
Examples: Demand units per week and Work Time Available per week.
Demand units per shift and Work Time Available per shift.
What if your Units of Measure are different for different processes?
Your Systems2win Value Stream Mapping template allows you to define both:
- The Common Demand Unit of Measure
The most common unit of measure for the end product
that is delivered to the customer of the entire value stream.Example: The Common Demand Unit of Measure for the product family produced by this value stream might be 'go carts'.
- Each process can optionally have its own Demand Unit of Measure
For example, one process might produce 4 'wheels' per 'go cart'.
And (unlike any other value stream mapping software on the market),
all values are automatically converted back into the Common Demand Unit of Measure
so that the math comes out correctly in the Time Sum Line for your Value Stream Totals.
Work Time Available
aka Time Available for Work, or Working Time Available
Definition
Time available to work toward meeting Demand.
Customer Demand should be expressed in the same Unit of Measure as Work Time Available.
Examples: Demand per week and Work Time Available per week.
Demand per shift and Work Time Available per shift.
Formula
How to calculate Work Time Available:
(Your Systems2win templates have fields with pop-up help to remind you, and to make calculations visible)
- Your initial starting number should NOT include meal times
- Then deduct regularly scheduled breaks and meetings
- Then deduct Planned Downtime
such as beginning of shift setup, end of shift clean-up, planned maintenance, and most other planned non-working time.
Tip: Optionally use your Custom Formula Zone to explain "Where did that number come from?"
Do NOT deduct unplanned downtime or change-overs.
Time Conversion
Several of your Systems2win templates allow you to calculate Work Time Available in minutes, and then a series of sophisticated formulas automatically convert Work Time Available into your chosen Units of Measure for Cycle Time (which might be seconds, minutes, or hours), and Lead Time (which might be hours, days, or weeks), and Work Time Available (which might be shift, batch, day, week, or any other unusual work cycle).
If you pay your expensive Black Belts to invent their own templates... good luck with that.
Variations
Your Standard Work Template has special features to make Planned Downtime and other Out of Cycle Work visible, understandable, auditable, and controllable.
That template will summarize Time per Unit for all Out of Cycle Work, and then in addition to Work Time Available, you also have visibility of 'Run Time Available'.
Run Time Available = Work Time Available minus (Out of Cycle Work * Demand)
Out of Cycle Work
Definition
Steps that are not performed in every Run Cycle,
but reduce Work Time Available to meet Customer Demand
Examples
Inspection, palletizing, routine maintenance, periodic quality inspections,
and any other activities that have their own cycles that happen regularly, but not with every Run Cycle.
Also includes setup change-overs between run cycles.
Approaches for how to handle Out of Cycle Work
- The most common practice is to deduct
most Out of Cycle Work from 'Work Time Available'.See 'Work Time Available' (above)
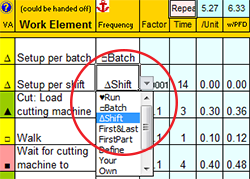
- Your Standard Work Template
has special features to use 'Frequency' codes
that make Out of Cycle Work visible,
understandable, auditable, and controllable.
Lead Time
Also known as Throughput Time, Delivery Time, Elapsed Time, or Turnaround Time
Definition
The time it takes
for one unit
of the thing being transformed
to go through every step of the process (or every process of the entire value stream)
from start to finish including time waiting between steps
Formula
The Lead Time Chart in your value stream mapping template makes it very easy to see that Lead Time consists of:
the sum of Process Lead Times (time within a process)
+ the sum of Queue Times (time between processes)
(and your value stream mapping template makes it easy to include or exclude Pre and Post-Production processes. Learn more)
Variations
In practice, the term "Lead Time" usually means "Production Lead Time", but lead time can also optionally include steps that happen before or after production:
Production Lead Time
The time it takes to physically make or deliver the thing from the receipt of production authorization to customer delivery.
Order Lead Time
The time between a customer placing an order and receiving delivery.
Production Lead Time plus everything that happens before releasing Work Authorization, and after the product leaves the shipping dock.
Order-to-Cash Time
Time between receiving customer order and receiving payment.
Quote-to-Cash Time
Time between receiving a customer request for quotation and receiving final payment.
(Of particular interest for make-to-order production environments)
Lead Time Units of Measure
Your Value Stream Mapping template has a Lead Time Unit of Measure Converter that allows you to quickly switch between Working Days, Calendar Days, Weeks, or Hours.
Learn to use all three ways to calculate Lead Time for a value stream map.
Queue Time
Also known as "Waiting & Transportation Time" or "Inventory/Transportation Time"
Definition
The time between processes
Time that the thing gets shuffled around or sits around waiting for someone to work on it.
See advanced training for how to handle queue time for a shared process.
Process Lead Time
Definition
The time that a batch is being worked on within each process
Formula
Unless you override it, Process Lead Time is calculated as
Cycle Time * Pulse Batch Size (also known as Pitch Batch Size)
Cycle Time is converted into the same unit of measure as lead time.
For example seconds or minutes, must be converted into 'working days', taking into consideration all of the factors that affect Work Time Available.
Fortunately, your Systems2win templates do this math for you.
Why would you override it?
If 'the thing' continues to be transformed in a way that does not involve the operator...
(perhaps drying, curing, growing, fermenting...)
then you might override Process Lead Time, as explained in our training for Value Stream Mapping.
Examples
For example 60 seconds = a very tiny fraction of a working day but a batch of 100 items * 60 seconds per item becomes substantial enough to ignore at your peril.
Process Time
Also known as "Processing Time" or "Touch Time"
Definition
The time that the thing is being worked on by an Operator.
Processing time is observed with a stopwatch or video camera following one unit being processed by one operator all the way through the process.
In an analytical environment, Process Time includes both "think time" and "touch time".
Use a Time Observation Worksheet to collect and filter your stopwatch results.
Your Systems2win templates include multiple choices of Time Observations worksheets that are appropriate for different types of observations and different types of processes.
Be sure to coach your people to learn and follow to the instructions for how to collect accurate Time Observations while improving (not degrading) rapport with the people being observed.
Formula
Process Time = Manual Work + Walking + Waiting
That portion of Processing Time that is performed by the Production Department is sometimes called "Operator Cycle Time", but Processing Time might also include time spent in sales order processing, engineering, approval cycles, etc.
Note that Machine Time is NOT included in Processing Time.
If the Operator has nothing better to do than stand around to wait for the machine to finish doing its thing, then that is called 'Wait time', and Wait Time is included within Processing Time.
Just remember...
Processing Time is all about the Operator
(not the machine)
Personal Fatigue and Delay
It would be impossible for any worker to maintain 100% efficiency, every working hour of every day.
Personal Fatigue and Delay is an adjustment factor multiplied by Process Time
to adjust for personal needs, fatigue, and work interruptions.
The U.S. Department of Labor requires a Personal Fatigue and Delay factor of at least 1.2 when paying piece work, and even if you're not paying piece work, it can be very helpful to adjust your capacity planning for a dose of reality.
Your Standard Work Template allows you to analyze Process Time both with and without Personal Fatigue and Delay.
Activity Ratio
Definition
The ratio of how much time your people are actually working on their order vs. how long your customer waits
An often embarrassingly small number that makes it painfully obvious how much room there is for improvement.
Formula
Activity Ratio = Process Time / Lead Time
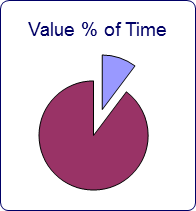
Value Percent of Time
Definition
The ratio of how much time your people are doing something your customer values vs. how long your customer waits
An even more embarrassingly smaller number that makes it even more painfully obvious how much room there is for improvement.
Formula
Value Percent of Time = Value Add Time / Lead Time
Additional Considerations
The dark purple is Lead Time. The light blue is either Process Time or Value Add Time.
As your lead time shrinks, it is not uncommon for your pie chart to be mostly blue.
It is even possible to have an Activity Ratio of greater than 100%.
This can happen if you have simultaneous processes, and/or multiple operators.
If your Activity Ratio nears or exceeds 100%, you might edit your chart (or create a new one) to measure Process Lead Time / Lead Time.
Value Add Time
also known as Value Creating Time
Definition
Time of those work elements or process steps that actually transform the thing in a way that the customer is willing to pay for.
Although Value Add Time has a widely accepted definition, there are many opinions about how to sub-categorize Non Value Add Time.
One popular approach is to differentiate:
- Pure Waste (sometimes called "Type 1 Muda")
"Gee, that's embarrassing... let's stop doing that..."
- Non Value Add Time (sometimes called "Type 2 Muda")
Things that currently "have to be done", but don't directly provide value to the customer.
See our online training for Muda — the 7 Types of Waste.
Some non-customer-facing supporting value streams, (such as accounting, purchasing, IT...), won't have ANY Value Add Time (using the classic definition)...
For this reason, some teams differentiate "Customer Value Add Time" from "Organizational Value Add Time".
Lean Healthcare Example:
Time spent examining a patient is customer value add time.
Doing patient admission paperwork might be organizational value add time.
And waiting in the lobby is clearly non-value add time.
The important thing is for YOUR team to agree upon YOUR definitions, and then use them consistently.
Which tool to use for Value Add Analysis?
Some practitioners do Value Add Analysis using a Value Stream Map but potentially complex processes are depicted with a single Process Box, so it is often not very useful to try to label the entire process either 'Value Add' or 'Waste'
Your Swim Lane Functional Flowchart and Standard Work Analysis templates have far more useful features for Value Add Analysis which is more appropriately done at the process level, rather than the value stream level
Machine Time
Definition
The time that a machine is working on the thing
Machine time is the total time that the machine is working on the product. Whether or not the Operator has something better to do than to stand around waiting for the machine to finish has no influence on Machine Time.
Example
If an automatic machine is running for 60 seconds, and the Operator has something valuable to do for 20 seconds, and then has 40 seconds of "Wait time", the Machine Time is still 60 seconds.
Machine Cycle Time
Machine Cycle Time = Machine Time divided by Quantity per Run
Example: If a machine makes 10 items at a time, then Machine Cycle Time = Machine Time divided by 10
Additional Considerations
If your process is potentially machine constrained, then you should be using your Machine Balancing template.
Although Machine Time is analyzed and charted in your Standard Work Instructions template, it is important to understand that your Standard Work template is "all about the Operator".
Machine time is only relevant if and when the operator has nothing better to do than to wait for the machine to finish. Operator 'Wait' time is very important to that standard work analysis. Machine time isn't.
In your Value Stream Mapping template, Cycle Time is usually calculated based on the Operator, but there is the option to calculate Cycle Time based on Machine Time for those processes that are constrained more by a machine than an operator.
Cycle Time
also known as Exit Cycles
Definition
The average time between completed units "coming out the end of the pipe"
Example
The cycle time of motors assembled at the rate of 120 per hour
would be 30 seconds per unit
Formulas
Cycle Time in a Functional Flowchart
Using your Cross Functional Flowchart template
Cycle Time is approximated as
Process Time divided by the # of Workers
Cycle Time in a Value Stream Map
Using your Value Stream Mapping template
Cycle Time = Time per Cycle / Qty per Cycle
or if those fields are blank... then...
Cycle Time = Process Time / # Workers
or you can manually override Cycle Time
in the cell to the right of each Process
Cycle Time in a Standard Work Combination Sheet
For Standard Work Analysis with more than one Operator:
Cycle Time = the operator with the longest Processing Time
Effective Cycle Time
Also known as Output Pace
Definition
Cycle Time adjusted for all the factors that reduce Work Time Available and Productivity.
In other words...
If a new-hire comes running up with a proud smile and says:
"I just finished using a stopwatch to measure Cycle Time, and it looks like we will just barely make our schedule, because Cycle Time is just barely under the Takt Time that we need to meed customer demand."
Then your response should be:
"You're new here, aren't you? Does this process ever experience downtime? Scrap? Rework? Staff unavailability? Less-than-perfect performance? Does it have any change overs?"
Your Systems2win Value Stream Map has color-coded andons that will turn bold red:
- if your planned Capacity is too close to your customer Demand
- if your Effective Cycle Time is too close to your required Takt Time
so that you can have confidence when you answer the (common) question:
"Will we be able to meet our schedule?"
Takt Time
Also known as 'rate of customer demand' or 'pace of customer demand'
Definition
Takt Time is your planning drumbeat.
How often completed units NEED to come out the end of the pipe as established by customer demand
and perhaps adjusted for Sales & Operations Planning factors, as explained in the Operational Takt Time section below
Formula
Takt Time = Working Time Available / Target Units to Produce
(usually calculated per week or per shift)
Examples
420 working minutes per shift / 210 Target Units to Produce during that shift = Takt Time of 2 minutes per unit
Doctors' office appointments are a common example of takt time scheduling.
With 1 patient scheduled every 12 or 15 or 20 minutes.
Related Concept
To fully understand Takt Time
you also need to understand Pulse (aka Pitch)
Pulse = Takt Time * Pulse Batch Size
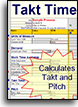
Takt Time Calculator
Tip: You can copy your
Takt Time Calculator
worksheet to any other
Systems2win template
Use your Takt Time Calculator template (Takt.xlsx)
to correctly calculate:
- Takt Time
- Work Time Available
- Pulse (also known as Pitch)
Variations of Takt Time
Operational Takt Time
In most real-world production situations, 'Takt Time' actually means 'Operational Takt Time' which is customer demand adjusted for factors such as:
- Seasonal demand
- Planned down-time
- New product introductions, etc.
In other words, in the real world, most people working on a process (even the leaders) don't have visibility to actual or forecasted customer demand.
So the 'Demand' used to calculate Takt Time actually comes from management (not directly from customer demand)
and is the result of management's Sales & Operations Planning process.
And in the real world...
'Demand' is often even further adjusted for the additional factors
described in the training in the next section below for 'Target Cycle Time'.
Tip: Many lean practitioners make no distinction between Takt Time, Operational Takt Time, and Target Cycle Time, so whenever you work with a new team member, it is a really good idea to clarify your Operational Definitions of what each of you means when you use the term 'Takt Time'
Takt Capability
In lean office, service, and other environments where it is hard to predict customer demand,
it is common to plan for the demand the process or value stream is capable of handling —
expressed in terms of both volume and mix.
Office Takt Time Example:
The quoting process is capable of processing 5 quotes per day, and only 1 of those can be a complex quote.
Takt Time per Run Cycle
Your Standard Work template features both 'Takt Time per Shift Cycle'
which is the more commonly known 'regular' Takt Time — described above
and it also calculates 'Takt Time per Run Cycle'
which is calculated by deducting 'Out of Cycle Work' from 'Work Time Available'.
The more experience you have calculating takt time for diverse types of processes, the more that you will appreciate the difference between:
'Takt Time per Shift Cycle' vs. 'Takt Time per Run Cycle'
Every experienced lean practitioner will have been vexed with questions like:
What if we reduce setup times? How will that affect Takt Time?
What about inspections, palletizing, and other things that happen at different frequencies?
In the past, those questions were answered with approximated guesses, because a lean practitioner had never had a tool capable of correctly answering those questions.
Now you do.
Learn more about the Standard Work template
Target Cycle Time
Also known as Planned Cycle Time, or Takt Time Per Run Cycle
Definition
Operational Takt Time adjusted for other factors
Other factors might include:
- Adjusting to shop floor conditions such as absenteeism, different-than-expected yields, etc.
- Master Scheduler discretion to plan for or react to the same factors that are considered within Sales & Operations Planning, but within a Sales & Operation Planning period, rather than across periods.
- Change Over Time if your process has multiple machines that run mostly unattended, then use your Machine Balancing template to determine the machine with the longest Change Over Time, and/or the Change Over Time for the machine with the longest total Machine Cycle Time, and then use that (one chosen number) as your Change Over Time for the entire inter-connected process.
It can be difficult to estimate/choose the number to use for Change Over Time, especially if it varies by products within the product families produced in a mixed model production environment, and it is very important to use your Machine Balancing template to re-evaluate your bottleneck or pace maker machine each time that you get a new machine, and each time that you do a kaizen event to improve your SMED Quick Change Over Setup Reduction for each machine.
- Unplanned Downtime
Refer to the DV sheet in your OEE template for all of the various Reason codes for Unplanned Downtime as well as Standby.
Note that Unplanned Downtime only considers small stoppages.
Catastrophic disasters cannot and should not be considered in your production planning.If you have gaps between shifts, then Unplanned Downtime is usually NOT considered in your calculation of Target Cycle Time — because you can (and often should) handle unplanned downtime with simple tolerances (allowing a little extra time per shift to still fulfill production requirements even if a few small things go wrong), and/or overtime.
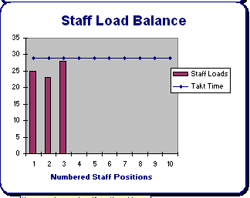
- Wait Time
When doing Staff Load Balancing for a process that is divided between several staff positions, it is common to need to add Wait time to the Standard Work for some staff positions in order for each sub-job to be synchronized to the same Target Cycle Time. (as depicted in the chart on the right)
Many consultants and lean professionals have differing (and often strong) opinions about what factors to include and exclude from Target Cycle Time.
The important thing is to clearly define how Target Cycle Time is calculated for YOUR team, and then ensure that everyone calculates it the same way. A good place to document your agreed-upon factors to include and exclude from Target Cycle Time is the User-Defined Training section near the bottom of the Help sheet of each Systems2win template. (And remember, this is one of the many types of personalizations that will be automatically found and transferred each time that you upgrade your templates.)
Some lean professionals have equally strong opinions about whether to call it Target Cycle Time or Planned Cycle Time. It's a good thing your Systems2win templates can be so easily personalized to use a User Substitution to call it whatever you want.
In many environments, Takt Time, Operational Takt Time, and Target Cycle Time are all the same,
and the single term "Takt Time" can be used.In other environments, especially High Mix / High Variability environments,
the differences can become important.Target Cycle Time must be less than or equal to (and is usually equal to) Operational Takt Time.
Takt Image
Definition
Any visual, at-a-glance way to monitor whether a process is meeting its takt time.
Examples
Folders in an in-box. Colored chart. Heijunka box. A runner that comes around every Pulse cycle (aka Pitch) to take away finished work and bring materials needed for the next Pulse cycle.
Pitch Pulse
We found that few people were familiar with the term 'Pitch', and it isn't easily translated, so we started calling it 'Pulse', to more accurately describe this important lean control.
Definition
If Takt Time is your planning drumbeat. 'Pitch Pulse' is your production drumbeat.
How often work is released to the pacemaker process, and how often work progress is monitored throughout the entire value stream.
Formula
Pitch Pulse = Takt Time * Pulse Batch Size (the batch size in which work is released to the pacemaker)
Why Pulse is more important than Takt Time
For production schedulers, Takt Time is really important.
But for the other 99% of your workers that actually produce and deliver your product or service... Pitch Pulse is far more useful.
For them, Takt Time is theory that they never see.
(unless they are producing a batch size of 1, so that Pitch and Takt Time happen to be the same number)
Pitch is the real-world 'production drumbeat' that sets the pace for how often work arrives at their workstation, and how often management checks in to ensure that they are keeping up the pace.
This important management control is often overlooked
In addition to the (much more popular) Takt Time,
Pitch Pulse and (related) Pulse Batch Size
are the other 2 variables that management can control
in order to manage the (all-important) FLOW of work
that sets the pace for how work pulses through your entire value stream.
Example
Example for work release: Golf course 'Tee Times' as 'Pulse'
On a typical day, golfers pulse through the golf course at the rate of one group per Tee Time.
Tee Times are scheduled at an interval establised by the golf course at a pace that allows a typical foursome of golfers enough time to complete the pacemaker hole (usually a par 5).
Notice that if you define your 'thing being processed' as a 'foursome',
then Pulse is identical to Takt Time
because your Pulse Batch Size = 1 foursome of golfers.
If, however, you define your 'thing being processed' as a 'golfer',
then Pulse and Takt Time will be different.
Let's say that golf course records show that the average 'foursome' is actually a 'threesome'.
(or perhaps there is a an average of 3.2568 golfers per group, but let's keep math simple)
Then Tee Times (Pulse) will be 3 times longer than Takt Time per golfer.
On some days, however, a large group reserves the entire golf course.
And on those days, it is common to speed things up by using a 'shotgun start'.
The first 18 groups of golfers are instructed to drive out to the tee box for their assigned hole, and then start golfing when they hear the shotgun.
So in this situation, the Takt Time remains the same.
But the Pulse would be the Takt Time (typical Tee Time intervals) multiplied by 18 'foursomes'.
Assuming that you are measuring Takt Time by groups of 'foursomes' instead of individual 'golfers'.
Just to be really clear... this example has one flaw.
If there are more than 18 groups of golfers in this tournament, then the 19th and following groups will usually begin teeing off at the interval of the typical Tee Times.
A more correct understanding of Pulse would be if the next 18 groups of golfers all waited to tee off at the next 'shotgun' start time.
Or an even more correct understanding of Pulse would be to understand that typically a Pulse Batch of work is released only to a single control point operation (the tee box for the first hole), and then all of the groups of golfers play their way through all 18 holes, and then at the next Pulse cycle, it is expected that the final 18th foursome from the initial Pulse Batch should have just completed playing the first hole... so the next batch of 18 foursomes should be ready to release.
Example for how Pulse is monitored:
It can be helpful to think of Pulse like a train station or a bus stop.
The bus comes around on a pre-determined schedule,
and you either make your bus or you don't.
The big difference is that the bus driver NOTICES that you're off schedule —
and immediately sends up a red flag that triggers a troubleshooter to very quickly show up at your workstation to do whatever it takes to help you get back on schedule.
Inverse Pulse
aka Inverse Pitch
If Pulse is less than Takt Time, then this is known as Inverse Pulse, and often requires creative ideas for how to establish Pulse Batch Size and/or a visual Takt Image.
Ideas like:
- Break work into an assembly line, with work being completed in small chunks, and either the worker or 'the thing' moves to another work station for the next processing step.
- Have the worker validate completion of sub-phases of work — and provide obvious visual feedback as to whether the process is on or behind schedule.
- Provide the worker with only enough materials and/or instructions to do what is needed for the next Pulse increment.
- Create FIFO lanes with obvious visual feedback re: expected vs. actual progress.
- Hire an experienced Lean consultant — who can help you invent creative ways to release and monitor work in a rhythmic and highly visual way — that reliably triggers a quick response whenever work falls behind schedule.
Pulse Batch Size
aka Pitch Batch Size
Definition
how many things to be processed get released to the pacemaker operation for every Pulse cycle
Formula and Examples
If Takt Time is 10 seconds, and pallet size is 1200 units
then Pulse = 10 seconds x 1200 units = 12000 seconds (or 200 minutes)
Every 200 minutes — the production scheduling department releases instructions for the pacemaker work cell to produce another 1200 units of the thing to be processed
If Takt Time is 15 minutes and new patients are assigned to doctors in batches of 4 client folders
then Pulse = 15 minutes x 4 client folders = 60 minutes (or 1 hour)
Every hour — the physician's assistant releases another 4 patient case folders to each doctor
Factors to consider when choosing Pulse Batch Size
which in turn determines the Pitch Pulse time increment
- The "delivery unit" that is delivered to the end customer.
perhaps pallet size, case size, the amount of time that the doctor needs for an average patient visit, etc.
- In a mixed environment, the Pulse time increment should usually not be lower than the longest time to produce one "delivery unit" of any item in the product family.
- The batch size that is delivered between processes.
Inter-process transport considerations can be especially important if your product is large or cumbersome
- How often do you want to monitor production progress?
For example, if you want to monitor progress at least 4 times per shift — then Pulse should be 2 hours or less.
- It is always best if Pulse is rounded to the nearest increment of Takt Time.
If you are just getting started mapping a value stream for the first time,
and your team isn't ready yet for "the Pitch Pulse discussion",
then as the leader, you can simply enter your typical or median batch size, and then perhaps just hide those rows, and come back to them as your team matures on their lean journey.
Optional Override
Once you have chosen your Default Pitch Pulse Batch Size
(which you enter in the pink cell in the 'Values' column on your value stream map)
then you can optionally override Pulse Batch Size for any operation.
But usually not.
Usually every operation in the value stream beats to the same heartbeat.
If you do override, it is usually an increment of Default Pulse Batch Size.
For example, 2x or 3x.
Technical Design Note:
If a process uses the default Pulse Batch Size for the entire value stream, then the Pulse rate for that process will be the default Pulse for the entire value stream.
If you override the default Pulse Batch Size, then it calculates Pulse rate for that specific process, taking into consideration Takt Time and Work Time Available for that process, which might be different from those values for the entire value stream. This can cause confusion because if the number that you enter into the override field is the same number as the default Pulse Batch Size for the entire value stream, you might get a different Pulse rate (calculated based on WTA for that unique process).
Important
Do confuse Pitch Pulse Batch Size with Change Over Batch Size.
Change Over Batch Size
Definition
how many things get processed before a Change Over is needed (to reset or change equipment)
Additional Considerations
Change Over Batch Size can be identical to, or dramatically different from Pulse Batch Size (defined above).
While the pacemaker operation usually determines the Pulse Batch Size for every other process in the value stream, Change Over Batch Size can be (and often is) different for some processes.
To extend the above examples:
The doctor works on only one patient at a time — not 4 patients at a time.
Perhaps an intern might come in to re-set or change the configuration of the room between each patient visit.
The 1200 units in each pallet might be made in batches of 12,000 before equipment change-over is needed
or, (keeping in mind that one of the objectives of Lean is to produce in the smallest batch sizes possible...)
the 1200 units in each pallet might be made in Change OverAs explained in the books Creating Continuous Flow and Creating Mixed Model Value Streams, if you have a machine or process that requires a 'Change Over Batch Size' greater than the rest of your processes, then that process must be decoupled from the rest of your continuous flow process, using either:
- A FIFO lane
- A supermarket
- A (non-Lean) pile of inventory
Learn how to use your Systems2win Value Stream Map to calculate the Smallest Change Over Batch Size for your pacemaker and/or bottleneck operations.
Guaranteed Turnaround Time
Also known as GTT, Every Part Every Interval, EPEI, or EPEx
Definition
The longest time that your customer will ever wait for any product variation within the product family produced by your value stream.
Provides a rock-solid answer to your customers' most common question:
"When can I have it?"
Formula
The formula for Guaranteed Turnaround Time =
(Average Time per Change Over * # Product Variations) / Time Available For Change Overs
Caution:
This classic formula assumes that (of course) you will be using the optimum Smallest Possible Batch Size.
Most people don't even know how to calculate the optimum Smallest Possible Batch Size, and even if you correctly calculate it, there are many legitimate reasons to use a larger batch size
(Container sizes, machine optimization, batch sizes of other processes in the value stream, pulse batch size, or perhaps your customer simply doesn't need it that fast so you'd simply rather make bigger batches)
When you use your Systems2win Value Stream Mapping Power Tool to calculate GTT, your chosen Change Over Batch Size is taken into consideration, so that the resulting Guaranteed Turnaround Time provides the correct answer to your customer.
The much easier way to calculate it
Using your Value Stream Mapping template
Guaranteed Turnaround Time is auto-calculated for any process when you enter data for both:
- Time Per Change Over
- # Product Variations
Additional Considerations
When to calculate Guaranteed Turnaround Time
For most value streams, you will calculate Guaranteed Turnaround Time for one (and only one) process the one process that you chose as the pacemaker process for the entire value stream
Exceptions to that rule you might also calculate Guaranteed Turnaround Time for non-pacemaker processes that are:
- Work Processing Cells
A powerful way to establish visual flow in an office or service environment,
by establishing a systems where everyone involved in a process works together on a process, but only at a specified time, which might happen on a less-than-daily cycle.- Other processes that are in some way detached from the flow established by the pacemaker
Requirements for EPEx to be meaningful
- You must have clearly defined your product families
using your Product Family Matrix template
- You must have established flow for your value stream
see training for A Typical Lean Journey
Standard Work In Process Inventory
Definition
The amount of inventory that SHOULD usually be found at specified locations within a process
Additional Considerations
One of the methods of Lean process improvement is to clearly define exactly how much inventory should be located at each specific place within a process — and then reorganize the workplace so that there is only space available for exactly that quantity of inventory.
One objective of Lean is to reduce the amount of inventory required, but buffer inventories hide problems so be careful to "lower the inventory swamp waters slowly" so that the rocks and alligators lurking just below the surface of your process can be systematically identified and removed one at a time — rather than "draining the entire swamp all at once".
Refer to Systems2win Lean & Kaizen online training.
Lean Office and Administration
Just because your process might not have inventory doesn't mean that Standard WIP is irrelevant.
See online training for Lean Office and Administration to learn how to reduce your piles of emails and papers.
Percent Complete and Accurate
aka First Pass Yield or Rolled First Pass Yield
Definition
The percent of deliverables that are received by the downstream operation or customer that do not need correction, addition, clarification, or rework.
Several prominent lean authors suggest that this is the single most important lean metric for processes in Lean Office and Administration and Lean Healthcare.
Formula
Using your Functional Flowchart template, Percent Complete and Accurate is observed and entered directly for each Step
And then the bottom line 'First Pass Yield' = the product of all % Complete and Accurate for each Step
When doing Value Stream Analysis, Percent Complete and Accurate is derived from Rework.
The formula is 1 minus Rework.
In other words, if Rework is 5%, then % Complete and Accurate is 95%.
Rework = How often did it need fixing?
Percent Complete and Accurate = How often did we get it right? (without need for fixing)
Rework is the more popular metric in Lean Manufacturing.
% Complete and Accurate is the more popular metric in Lean Office and Administration.
Additional Considerations
The correct way to observe Percent Complete and Accurate is to ask the downstream recipient.
Don't ask the people doing the work. Ask the people that need to use their deliverables.
More Lean Glossary Terms
Gemba
The actual place where work is performed.
Kata
A structured way of thinking and acting that you practice until the pattern becomes a habit.
Learn more about Kata.
Sensei
Mentor, coach, teacher...
And every sensei needs their own sensei.
Consensus
Everyone feels that their ideas and concerns have been sincerely heard and listened to, and they are willing to fully support the agreed-upon course of action — even if it wasn't their first choice.
Consensus is NOT:
- Unanimous agreement
- Majority rule
OEE Overall Equipment Effectiveness
See the separate Glossary of terms for TPM Total Productive Maintenance and OEE Overall Equipment Effectiveness.
Lean Dictionary
Suggested Reading
- Site Map of Lean Training and videos
- Process Improvement Tools
- Roadmap for a Typical Lean Journey
- Value Stream Mapping
- Visual Management Systems
Books
- APICS Lean Dictionary
- Lean Lexicon
Training to get you started.
Tools you won't outgrow.
The right DMAIC tools
to Define, Measure, Analyze, Improve, and Control
the quality of ANY process
Training and Videos
Your Systems2win templates come with Training & Videos to get the most from your process improvement tools

Training and Coaching
Consider Training and Coaching to support your teams to succeed
Training to get you started.
Tools you won't outgrow.
Schedule a Conference
Schedule a conference
to discuss your challenges
with an experienced lean advisor
150+ Templates
Try Some
Own Them All
Download Trial Now
Get a dozen trial templates,
and another dozen free gifts
@@@ Better conversion rate
if call to action is for a specific tool, and shows the image
Try It
Try this template
along with a couple dozen more
process improvement tools
Calls to Action Botttom
Related Topics
Related Topics section WITHOUT TESTIMONIALS
Replace this paragraph with menu library item for topics related to this video
Training and Coaching
Consider Training and Coaching to support your teams to succeed
Training to get you started.
Tools you won't outgrow.
Schedule a Conference
Schedule a conference
to discuss your challenges
with an experienced lean advisor