
Process Improvement Tools.
Standard Work.
Work Instructions.
Flow Chart templates.
Swim Lane Cross Functional Flowchart.
Value Stream Mapping.
Lean tools.
Yamazumi Chart template.
Time Study templates.
DMAIC tools.
Quality Improvement tools.
House of Quality QFD.
FMEA Risk Reduction.
Root Cause Analysis tools.
Problem Solving tools.
OEE.
Preventive Maintenance.
Skip to main content


Additional training


Installation and Setup
Installation - Each User. Installation - Multi-user. Language Translations. Personalize Your Templates.Systems2win Training.
Quick Start Initial Training. New User Training. Training Matrix. Systems2win Leadership. Training Classes.Lean Training
Lean Training and Coaching. Lean Principles. Muda 8 Wastes. Goal - Lean Flow. Roadmap - Lean Journey. Value Stream Mapping. Standard Work. Hansei Lean Thinking. Lean Dictionary. Online Lean Training. Lean Leadership.Microsoft Office Training
Excel Training. Excel Drawings (without Visio). Excel Charts. Word Training. PDF Training. Document Storage and Naming.Support
Support.OEE Template
Total Productive Maintenance TPM Software for Overall Equipment Effectiveness
OEE Toolkit to solve problems
(not just identify them)
The big difference between this and any other Lean OEE software
is that you are empowered with all of the tools that you need
to solve downtime problems, not just identify them.
Use your OEE software to...
Visually highlight problems
Pink and yellow cells direct your attention to exceptions outside of your user-defined Andon Tolerance levels.
Filter your reports
to drill down to greater levels of detail for anything that catches your eye.
With all the power of Excel
to generate any type of chart
to graphically illustrate problems that you find.
Andons, filters, charts, and all the power of Microsoft Excel
And then once your OEE template has fulfilled its purpose...
(to identify where to focus your attention)
You have tools to solve the problems that your OEE Software identified
This OEE software comes with an entire suite of Excel templates to scientifically experiment with countermeasures to reduce or eliminate the problems identified by your OEE software.
OEE Videos
- OEE video — Leader Preparation (6 mins)
- OEE video — Daily Log Data Entry (9 mins)
- OEE video — Data Analysis (6 mins)
Additional training
relevant to this template
The Sample and Help sheets of every template always contain training relevant to THAT template
- Quick Start Initial Training
What every user should know to use any Systems2win template - Language Translations
Every Systems2win Excel template is available in ANY language - How to Personalize your Systems2win templates
- Table of Contents for this OEE training page
Also see the rest of the Quality Improvement tools that come with your OEE template
Prepare to use your
OEE template
Before getting started
Launch your team
using the same tools and systems that you use to launch every team for continuous process improvement
Train your users
Foundational concepts to understand
A Work Center is defined as "One machine, or a group of machines that are reported on a single Log, and are treated as one entity for OEE reporting."
You will maintain a separate Log sheet for each Work Center.
Although a single workbook can have several Log worksheets, we usually suggest maintaining each Work Center Log in a separate Excel workbook.
For OEE Analysis, the Logs for all related Work Centers will be imported into one shared OEEData worksheet, which can be in the same workbook with one or more Log sheets,but usually has its own separate workbook.
Personalize your template
Your leaders should have already personalized your workbook to hide or show the sheets that you will need:
- If a workbook will be used only for OEE Analysis, then the unused Log sheet should be hidden.
- If a workbook will be used only as a data collection Log, then the unused OEEData sheet should be hidden.
- If a workbook will have more than one Log sheet, then use the special Systems2win menu > Copy Sheet utility to copy the sheet
Example: If some of your Work Centers gather data using pen and paper, that data can be transcribed directly into the workbook that is used for Analysis, which would have one Log worksheet per Work Center.
Your leaders should have already personalized the DV sheet in your workbook with:
- typical dropdown lists for YOUR organization
- Cycle Time Unit of Measure
- the 'Ideal Cycle Time' for each Product or Product Family
As explained in the Foundational Concepts above, you will usually have a separate workbook for each Work Center, and the DV sheet in each workbook might be personalized with some values that are unique to that Work Center.
How to use your
OEE tracking spreadsheet
Find and open your template
Find and open your OEE template
(OEE.xlsx)
in the same way that you find and open your other 150+ Systems2win templates.
If you don't yet own a license, you can download your free trial now.
Save your working document
following the usual document storage and naming conventions established by your leaders
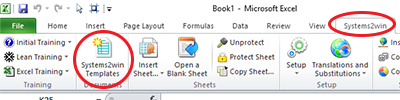
Open a Blank Sheet
When you're ready to start doing your own real work...
click the button to 'Open a Blank Sheet'
Excel Ribbon > Systems2win tab > Open a Blank Sheet
This blank sheet is where you will do your real work
(not on the Sample sheet — which gives you sample data that is extremely helpful for learning how to use your new tool, but is the wrong place to do your real work)
Rename your new sheet.
If English is not your preferred language
Switch to your language, just like every Systems2win Excel template.
Now you are ready to start using your
OEE Calculation Spreadsheet
Enter header data
At the top of each Log and/or OEEData sheet, enter data in the header fields.
Collect your OEE data
You can collect data for each Work Center in any one of 3 ways: (which can vary by Work Center)
- Enter data directly into a Log sheet
- Collect data using a paper form — then re key into a Log sheet
- Use Automated Data Collection
using a scratch workbook to convert the data into a format that matches the Log sheet — then import that data to a Log sheet
Daily Events Log sheet
On each Log sheet
On each Log sheet - data is entered in 3 sections and you can click the Navigation links to quickly move between sections
Top Log entries
Make a single log entry of Good Units produced for each combination of Shift and Product/Family.
If you make more than one Product (or family) per Shift,then allocate Available Time by Product/Family — ensuring that total time for the Shift is correct.
The 'Batch' column should usually be left blank except for those (usually rare) Shifts where you make multiple batches of the same Product within a single Shift.
If this never happens in your world... simply hide the entire 'Batch' column.
Rejects
Make a log entry for each batch of Rejects.
For OEE purposes, Rework is just another Category of rejects.
See more complete discussion in the OEE Glossary.
Lost Time Events
Always make a log entry for any event that stops production longer than the 'Downtime Threshold' number of minutes.
Shorter minor stoppages will be reflected in 'Performance Loss'
Import data from each Work Center Log
On each Log sheet...
Filter for the Date range that you want to import to your central OEEData worksheet.
On the OEEData sheet… (which is often in its own workbook)
click the button to 'Import From Daily Log' then select the workbook and worksheet to import.
Caution: There is no validation that data does not already exist for the Work Center / date range that you specify. If you accidentally import the same data twice, you can simply delete the duplicate rows.
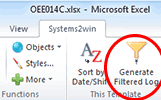
Generate Analysis sheets
On a Log sheet...
Use Excel's Filter features,
then click the button to 'Generate Filtered Log'
On the OEEData sheet...
Use Excel's Filter features,
then click the button to 'Generate Filtered Worksheet'
Click the Andon button.
Any values outside of your user-defined 'Andon Tolerances' will be shaded pink, and anything half way close will be shaded yellow— so that you can quickly focus on problems needing attention.
Experiment with Countermeasures to problems that get revealed
Once you have used your powerful OEE software to identify and illustrate your problems...
the next question becomes...
"So what are we going to do about that?"
That is where most OEE software leaves off...
perhaps continuing to ask if you would like to generate yet another type of chart to further illustrate the problem that you have already clearly defined.
This OEE template comes with an OEE toolkit to solve the problems that you identify
When you own your Systems2win templates, you have the tools that you need to actually
solve the problems that your TPM analysis has identified
Depending on the nature of your top priority problems, you might use...
- Any of your Lean Management Systems
- Your Preventive Maintenance Checklist
- Your Yamazumi Chart for operator work load balancing
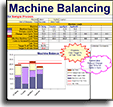
- The Machine Load Balancing worksheet to balance your machine loads
- The Standard Work Combination Sheet for SMED Quick Changeover
- Work Instructions, Standard Procedure template, or TWI tools
to improve employee training (which is often among the root causes for those unacceptable numbers that keep showing up in the pink andons)
- The Cross Training Matrix to ensure that every job is cross trained
without a noticeable down-spike in OEE Performance and Quality every time that someone gets sick or takes a vacation
- The 5S Scorecard to ensure that all work areas are clean and organized
- The Standard Work Audit
for a systematized way to ensure that the most challenging 4th and 5th S's stay front and center for years (not just days) after your initial 5S push
- Value Stream Mapping
to help with the decision of where to focus your attention (including OEE attention) on those segments of the process that will yield the greatest return on your efforts
- Kaizen Events, Kata Coaching, A3 Reports and Gantt Chart Project Plans
as field-proven systematic approaches to actually solve problems revealed by your OEE analysis
- FMEA to pro actively identify and minimize potential risks
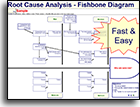
- Root Cause Analysis Fishbone Diagram to brainstorm creative problem-solving
- QFD House of Quality and Cause & Effect Matrix and Design For Six Sigma
to ensure that you are solving problems that your customers actually care about
- Hansei questions to stimulate Lean Thinking
Wouldn't it be depressing to just be told about all of the problems that you have?
Wouldn't it be more helpful to actually solve the problems that your OEE software identifies?
The Six Big Losses of OEE
Availability
- Changeover Time
- Equipment Failure
Quality
- Changeover Yield Loss
- Rejects and Rework
Performance
- Reduced Speed of Equipment
- Standby
(waiting for an external problem to be resolved
Use OEE Software
to identify and improve
all of these six major lossesOEE = Availability * Quality * Performance
OEE Excel Template: Advanced Training
Create your own charts
In addition to the many charts in your standard template, you can also optionally add your own, using everything you know about Excel charts.
You can also hide unused charts. Or move them out of the Print Area. Or change the Print Area.
It's Excel. Use everything you know about familiar Microsoft Excel.
Suggestions to keep file sizes manageable
Use separate workbooks to maintain a Daily Log for each Work Center.
Hide or delete unused Analysis sheets
Perhaps start with a copy (or multiple copies) of your workbook to use for generating (temporary) Analysis worksheets.
Save an archive workbook at least every year, or whenever file size becomes slow.
Rather than starting a fresh workbook, perhaps simply delete archived data, leaving some recent history to work with going forward.
Do not exceed 5000 rows of data on any single worksheet.
The Excel 'GoTo' function can fail if there are too many noncontiguous hidden rows.
To import data from Automated Data Collection Devices
Import data to an interim Excel workbook, then write macros in that interim workbook to get the data into a format that matches the Systems2win worksheet where you want to import your data.
You will usually import to a Log sheet, but could also import directly to an OEEData sheet.
Then 'Paste Special > Values' to the next unused data rows.
Home tab > Paste > Paste Special > Values
Note: Custom programming assistance is available at Systems2win's regular hourly billing rate.
OEE Weighting
OEE Weighting only becomes important when aggregating OEE across dissimilar equipment and/or products
which is a highly discouraged bad idea...
because OEE is intended only to measure and improve the effectiveness
of the same equipment over time.
It was never intended to serve as a universal accounting standard to compare diverse environments to each other.
But if you feel you must…
then you can personalize your master template with your own User-Defined Calcs on the OEEFilter sheet to apply any weighting system of your choosing.
You cannot change part of an array
If you get this error message, then you are trying to customize something you shouldn't.
You might be trying to delete or move columns that must remain unchanged in order for the Systems2win macros to work.
Manual Collection of OEE Data
OEE Data Collection Form
Work Centers that don't have either Automated Data Collection or a nearby computer will collect their OEE data on a printed paper form. (OEE-Paper.docx)
And then later, the manually collected data gets entered into your OEE template for analysis.
Category and Reason Codes
To print a list of your (user-defined) Category and Reason Codes, you can either:
- Simply Print the DV sheet
(the codes will be printed on several separate pages)
- Or you can create your own "cheat sheet"
Tip: When copying to your custom workbook, use Paste Special > Values
OEE Calculations
and glossary of terms
for TPM Total Productive Maintenance and OEE Overall Equipment Effectiveness
Use CTRL+F to find keywords
Also see Lean Dictionary
OEE Overall Equipment Effectiveness = Availability * Performance * Quality
OEE is calculated by multiplying 3 sub-measures:
1) Availability: % of actual uptime to planned
2) Performance: % of actual throughput to target
3) Quality: % of good units to total
Framework for measuring process efficiency — by breaking it into 3 constituent components.
World class benchmark >85%
Availability = Net Operating Time / Planned Uptime
A pure measure of Uptime, excluding the effects of Quality, Performance, and Planned Downtime Events.
World class >90%
Performance = Ideal Cycle Time / Actual Cycle Time
A pure measure of speed, excluding the effects of Quality and Availability.
World class >95%
Quality = Good Units Produced / Total Units Produced
Total Units Produced = Good Units Produced + Rejects
A pure measure of Process Yield, excluding the effects of Availability and Performance.
World class >99% (and often >99.9%)
Work Center = One machine, or a group of assets reported on a single Daily Log
and treated as one entity for OEE reporting.
It is common for each Work Center to maintain their Daily Log in a separate Excel workbook — then copy and paste to a central OEE Data workbook that summarizes the OEE for several interdependent Work Centers.
Product or Product Family = What is being produced
For OEE purposes, it is often sufficient to report by product family
(rather than specific product or part number).
Good Units Produced = Units produced that meet quality standards — without rework.
Rejects = For OEE — any unit that not does meet First Pass Yield quality standards is a reject.
If rework might be performed later to attempt to salvage some value — then there is no question — rework is just another category of reject.
If rework is successfully performed during that same shift — then there are 2 schools of thought, and your organization needs to choose one of them, and use it consistently:
1) The reworked units are simply reported as Rejects.
2) The reworked units are reported as both Rejects and Good Units Produced.
Reject Category = User-defined reasons for reject
Some companies use this field exclusively for Reject Categories - such as:
- Reject produced during Regular Production
- Startup & Change Over rejects
- Rework
Others also include Reasons — or more details, such as:
- Scrap due to temperature variance
- Rework that surfaced downstream
- Rework that was handled in process
- Rejects that might be reworked later
Available Time = Total minutes available for work.
Don't subtract meals or breaks or planned downtime.
Do subtract downtime beyond team's control. For example: weather, natural disaster...
Usually 480 mins per 8 hour shift.
If the shift will be making more than one product, then split Available Time into time per Product or Product Family, being careful to ensure that the total adds up to the total Available Time for that Shift.
Yes, it is permissible to record Available Time for the entire day, rather than by shift, but why? Don't each of your shifts report their time and production and rejects? Why would you want to obscure shift details when doing your analyses?
Planned Downtime = Deliberate downtime that is excluded from OEE calculations.
Examples: Planned maintenance, equipment shut down during meals, breaks or meetings, planned downtime because there is no customer demand
(and one of the foundational lean principles is to produce no faster than the pace of actual customer demand)
Planned Uptime = Available Time minus Planned Downtime
aka: Planned Production Time, Net Available Time, Scheduled Time, Running Time
It is unfortunate that there is no agreed-upon term for this important concept that is so foundational to OEE.
OEE starts with this amount of time, (if that's not foundational, what is?), and yet we could not find two books or software packages that called it the same name.
Like all Systems2win templates, you can use Insert Comment to add your own user-defined help to supplement (rather than replace) the standard Systems2win pop-up help (which will still be available in addition to your user-defined help — thereby making it easy for your users to translate your own in-house terminology with the terminology used in Systems2win's online training pages)
Loading Effectiveness = Planned Uptime / Available Time
Some companies also measure:
Equipment Utilization = Planned Uptime / Total Possible Available Time (1440 mins per day)
and...
TEEP Total Equipment Effectiveness Performance = OEE * Utilization
Systems2win has chosen not to track Utilization and TEEP in the standard template because:
- The entire concept of maximizing equipment utilization only fits lean philosophy in the rare situation where customer demand chronically exceeds capacity.
- Maximum Possible Available Time becomes confusing and difficult to track in diverse reporting environments
(as you will quickly discover if you ever work a second shift and attempt to program this metric with User Defined Calls) - TEEP is so easy to calculate once you know how many shifts are being worked per day. So we suggest simply using a hand calculator to calculate TEEP in those rare moments that you want to analyze it.
Downtime Threshold = Max time that work can be stopped before it must be recorded in Log
Anything that stops production longer than this number of minutes must be recorded in the Lost Time Log, and will therefore be included in Downtime Loss.
Shorter minor stoppages will be reflected in Performance Loss.
Downtime Loss = Change Overs + Standby + Unplanned Downtime
Any event that stops Planned Uptime longer than the number of minutes defined as the Downtime Threshold must be recorded in the Lost Time Log. Everything recorded in the Lost Time Log is included in Downtime Loss, which affects the Availability portion of OEE. Shorter minor stoppages get reflected in the Performance portion of OEE.
Change Overs
Setups, change overs, and adjustments to equipment.
Please note that Change Overs are NOT Planned Downtime, even if they are pre-planned.
Change Overs ARE included within OEE calculations as reduced Availability, and SMED Quick Change Over projects are among the most popular TPM activities resulting from OEE analysis.
That's why your Systems2win template breaks Change Overs into their own sub-category — rather than obscuring them in one big glob of Downtime Loss.
Standby
Production stopped due to:
- being starved by unavailability of upstream materials
- or backed up by unavailability of downstream production or storage capacity
You won't find Standby in very many OEE books, but several of our customers find it essential.
Especially when several Work Centers are grouped together in a highly interdependent production line or cell — it is very helpful to pinpoint your problem by ascribing Unplanned Downtime to only the one Work Center that caused all of the other Work Centers to be down at the same time.
The one Work Center with the root problem has Unplanned Downtime, and all of the other affected Work Centers have Standby time.
Unplanned Downtime
Anything other than Change Overs or Standby that stops production longer than the number of minutes defined in the Downtime Threshold.
Examples: Various types of equipment failure, operator unavailability...
Net Operating Time = Planned Uptime – Downtime Loss
Productive time available after downtime losses are deducted.
We have seen some books and software incorrectly abbreviate "Net Operating Time" to "Operating Time".
Operating Time has its own definition. Operating Time = Available Time – Planned Downtime – Change Overs
and is essential to the less popular calculation of NEE Net Equipment Effectiveness — which is almost identical to OEE, but Availability does not include Change Overs.
NEE = ((Operating Time – Standby – Unplanned Downtime)/Operating Time) * Performance * Quality
If you personalize the User Calcs in your Systems2win template to calculate NEE — then you will appreciate that we did not incorrectly abbreviate "Net Operating Time" to just "Operating Time".
Ideal Operating Time = (Good Units Produced + Rejects) * Cycle Time per unit
Does not penalize for quality Rejects
Ideal Cycle Time
If the Cycle Time Unit of Measure is seconds, minutes, or hours, then this is the theoretical fastest time to produce one unit
If the Cycle Time Unit of Measure is ppm parts per minute, then this is the theoretical fastest Run Rate (parts per minute)
Some companies use the Nameplate Capacity as a less-than-perfect estimate of Ideal Cycle Time
(Nameplate Capacity = the maximum speed estimate made by the engineers that made the machine)
but if the engineers guessed a little low, then your actual performance might sometimes exceed their estimate of fastest machine speed, which then results in an OEE Performance rating of over 100%.
Technically, no OEE component metric should ever exceed 100%, but as long as you consistently apply the same nameplate capacity over time, your OEE measure will still be useful for comparing OEE improvement on that machine.
This is a good example of why OEE is intended to be used only to evaluate the progress of a single Work Center, and is NOT intended to compare the efficiency of different Work Centers against each other.
All lean objectives
reduce or eliminate
the 7 types of waste
Performance Loss = (1 – OEE Performance Ratio) * Net Operating Time
aka Speed Loss, Performance Time Loss
The amount of time lost due to Performance inefficiencies, such as idling, minor stoppages, machine running at reduced speed...
Any slowdowns or minor stoppages less than the Downtime Threshold will show up in Performance Loss.
Performance Time = Net Operating Time – Performance Loss
Productive time before Quality Losses are deducted.
Quality Time Loss = Rejects * Cycle Time per unit
Time lost due to quality problems.
Productive Time = Performance Time – Quality Time Loss
aka Effective Time, Fully Productive Time, Net Productive Time
Actual productive time after ALL losses are subtracted.
The true bottom line of your process efficiency.
Andon = A system to draw attention to problems
When you click the Andon button in your Systems2win OEE template, numbers outside of your user-defined Andon Tolerance levels will appear pink, and values halfway close will appear yellow.
Waterfall Chart = Chart that graphically depicts each OEE element starting with Available Time, being reduced by each OEE Time Loss, and ending with Productive Time
Your Systems2win OEE template can instantly create a Waterfall Chart for ANY row that you want to analyze
which is something that most OEE software can't do...
which is one reason why some people import their existing OEE data to their Systems2win template for further analysis.
Suggested Reading for OEE
- Successfully Installing TPM in a Non-Japanese Plant: Total Productive Maintenance, by Edward Hartmann
This OEE calculation spreadsheet
comes with many useful Process Improvement tools to actually solve the problems that surface from your OEE analysis
The right DMAIC tools
to Define, Measure, Analyze, Improve, and Control
the quality of ANY process
Contents
New User Training
Your Systems2win templates come with free New User Training
to quickly learn features that are common to all 150+ templates

Process Improvement
Q and A
Ask us a question and see answers to common questions about process improvement.
Can't you just create a few tools in your free time?
How much free time
do you have?
to re-invent and support
home-made tools?
Own Yours Now
If your organization has
not yet provided a license,
own yours now
Training and Coaching
Consider Training and Coaching to support your teams to succeed
Training to get you started.
Tools you won't outgrow.
Schedule a Conference
Schedule a conference
to discuss your challenges
with an experienced lean advisor
150+ Templates
Try Some
Own Them All
Download Trial Now
Get a dozen trial templates,
and another dozen free gifts
@@@ Better conversion rate
if call to action is for a specific tool, and shows the image
Try It
Try this template
along with a couple dozen more
process improvement tools
Calls to Action Botttom

Related Topics
Related Topics section WITHOUT TESTIMONIALS
Replace this paragraph with menu library item for topics related to this video
Training and Coaching
Consider Training and Coaching to support your teams to succeed
Training to get you started.
Tools you won't outgrow.
Schedule a Conference
Schedule a conference
to discuss your challenges
with an experienced lean advisor