
Process Improvement Tools.
Standard Work.
Work Instructions.
Flow Chart templates.
Swim Lane Cross Functional Flowchart.
Value Stream Mapping.
Lean tools.
Yamazumi Chart template.
Time Study templates.
DMAIC tools.
Quality Improvement tools.
House of Quality QFD.
FMEA Risk Reduction.
Root Cause Analysis tools.
Problem Solving tools.
OEE.
Preventive Maintenance.
Skip to main content


Three Types


Installation and Setup
Installation - Each User. Installation - Multi-user. Language Translations. Personalize Your Templates.Systems2win Training.
Quick Start Initial Training. New User Training. Training Matrix. Systems2win Leadership. Training Classes.Lean Training
Lean Training and Coaching. Lean Principles. Muda 8 Wastes. Goal - Lean Flow. Roadmap - Lean Journey. Value Stream Mapping. Standard Work. Hansei Lean Thinking. Lean Dictionary. Online Lean Training. Lean Leadership.Microsoft Office Training
Excel Training. Excel Drawings (without Visio). Excel Charts. Word Training. PDF Training. Document Storage and Naming.Support
Support.Visual Management
Team Accountability Board and other visual controls for visual management
Lean Visual Management Boards
Whenever you add a new element to your lean production system,
you should also quickly add supporting lean management elements.
Every lean tool needs
a corresponding
Lean Coaching System
Focus on Visual Controls
When you focus on visual controls,
the other 2 elements will quickly and naturally follow.
Essential elements
of any lean management system
- Visual controls
- Routine accountability habits
- Leader Standard Work
What are Lean Visual Controls?
The term 'lean visual controls' can broadly include...
Any intuitively-easy-to-understand system for monitoring and controlling a process
with examples ranging from kanbans to painted golf balls,
but most common is the visual control chart
A visual control chart is...
any printed or hand-written chart that:
- is used for monitoring or controlling any aspect of production
- is posted in plain sight very near the place where the actual work is done
- is frequently updated with the latest results
timely enough to effectively respond to problems, not just historical post mortems
- graphically highlights problems
- has notes clearly articulating the reasons for 'misses'
(differences between expected vs. actual results)
- can ideally be understood at a glance by anyone passing by
Visual Management Board
Data hidden in a computer is not visual
A visual management system must be visual.
Data hidden inside a computer does not meet the above criteria
until perhaps it is printed, or otherwise reproduced in a way that meets the above criteria.
Balance between Computer and Handwritten
Visual Management Systems
Hand-entered data is better for
- Ownership "fingerprints"

When you are the author,
are you proud
of what you deliver? - Timely data entry onto the printed form
- Auditor initials
Computer-generated charts and forms
are better for
- Creating the underlying printed form
(that needs to be consistent, legible, easily reprinted...) - Computational accuracy
- Charts
- Data analysis
- Sharing and archiving
Most lean visual management systems include a diverse assortment of visual controls,
each with its own balance of hand-written and computer-generated elements.
Visual Management Examples
Examples of process improvement tools used as Visual Controls
| Visual Management Tools | |
|---|---|
| To lead and manage any team |
Many visual templates for Lean Leadership, and Lean Management Systems |
| For assessment of each team's overall progress on their lean journey |  Lean Assessment Lean Assessment |
For workplace organization to reveal problems |
 5S Scorecard
 |
To understand how each process fits in the value stream and to track key metrics to ensure that each process is not obstructing overall flow |

|
| To keep every team working in alignment with strategic objectives |  Hoshin Strategic Planning Policy Deployment Hoshin Strategic Planning Policy Deployment |
| To keep the team focused on their biggest issues |
|
Visual Task Assignment Board published on your |

or similar Team To Do List |
Monitor currently active projects What's the team currently working on? How are they coming with that? |

|
| To measure expected vs. actual results for ANY measure of team performance | |
| To publish the results of audits of team performance |   |
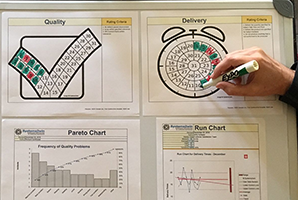
| To monitor quality |

|
To graphically depict the relationship between ANY two factors affecting an issue. |
Plan-Results Importance-Performance Effective-Achievable |
For a flow operation also for tracking expected to actual arrival times for 'water spider' material flow supplies |
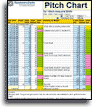
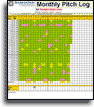
Daily Production and Monthly Pitch Log |
| Or to level the flow of both demand volume and mix variety | 
which technically is not a control chart,
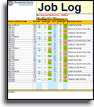
and Job-by-Job Tracking chart of expected to actual setup and run times |
| Pull system kanban order replenishment | 
Expected vs. actual
Priority Board Hourly Status chart |
| Preventative Maintenance | 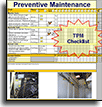
OEE bar charts |
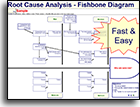
To visually tell a story of what challenges your team faced, and how you smashed those problems into submission |

|
To remind team members of why decisions were made and agreed upon |
|
To ensure that team members are trained and cross trained |

|
Standard Work to remind people of the way that everyone agreed to do it and to ensure that people are actually doing things the way you think they are |

|
|
Visual Management Systems are foundational to any Lean System |
|

Guidelines to invent your own
Visual Management Boards
These templates provide an excellent starting point
Why reinvent?
so that your expensive Black Belts aren't wasting time re-inventing tools that are common to many production and office environments...
but once your people understand the tools and systems that are readily available, and start to conceive ideas to make them even better to meet the unique needs of your unique processes...
then, yes, absolutely...
Invent your own visual controls
Starting with either:
- Any one of the above templates
that provides a good starting point to give you a great start
- A blank template
that gives your custom tool all the value-add features common to all of your 150+ Systems2win templates
- A blank Excel workbook
If you enjoy the challenge, and your employer is wiling to pay you for the non-value-add time to start from a white page and a blinking cursor
- A creative idea
Although Visual Control Charts are the most common type of visual control,
they aren't your only choice.Kanban signals might be golf balls, triangles, or all kinds of creative objects.
You might come up with creative colored flags to make your Lean Office Work Flow Cycle visible.
You might use colored lights for more than just jidoka andons.
Assuming that you are inventing a visual control chart...
Use everything you know and learn about familiar Microsoft Excel
and everything you know about how to personalize any Systems2win template
Go for it...
Create your own visual controls for any activity of any kind
Just make sure that any custom visual control that you invent meets the
Fundamental Requirements
of a Visual Control
- Compares expected vs. actual results
Because that's the primary purpose of a visual management system:
To reveal abnormalities, so they can be corrected quickly.
- Is visual
Not buried in a computer.
Problems are highlighted using graphics, colors, and creative ways to be intuitive and visual
- Is near the place where the work is done
So that the people doing (and supervising) the work can use the real-time feedback.
- Is updated frequently
Frequently enough to actually make real-time corrections. Not just post-mortems.
- Has notes explaining reasons for every miss
For post-mortems — that lead to measurable improvements.
- Is accompanied by a Lean Management System
That empowers leaders to actually do something about revealed problems — quickly.
Summary Recap
Visual Management Boards
Constantly reinforce focus on the process ...
using intuitive graphics and/or colors ...
that can be quickly understood by a newcomer passing by
What is most important about any visual controls, (that you copy or invent),
is that you, (the leader at any level)...
Understand the reason for having a visual management system
"By insisting through your standard work that the visuals are maintained and current, visuals constantly reinforce the focus on process.
This focus makes it easier to see the contrast between expected and actual process performance.
By doing this, visuals allow you to identify opportunities for improvement."
~ David Mann — Creating a Lean Culture
Do something
about problems revealed by visual controls
The primary purpose of any visual management system
is to quickly and visibly reveal process abnormalities
Any abnormality should prompt the following 3 questions
- Did this happen because no standard work exists?
- Did this happen because the standard is incorrect or incomplete?
- Did this happen because someone didn't correctly follow the standard work?
When measures are too green
If any measure is green more than 80% of the time, then consider lowering the water
(to reveal more stumps and alligators hidden beneath the surface of a too-easy standard)
Lower the inventory, shorten the time, reduce setup times, cross train people...
Do something to raise the standard —
to continuously improve
to the next level of higher performance toward lean ideals
The only way to solve a problem is to first expose it.
If the primary purpose of visual control is to reveal problems...
then the assumption is that you lean leadership team will actually
Do something about the problems that get revealed
- Perhaps launch a team, or expand the charter of an existing one
- Perhaps your team might maintain a Pareto Chart of the top 3 priority problems you are currently working on — and publish it on your Team Accountability Board.
- Perhaps a team member might volunteer to lead an A3 problem solving exercise.
- Perhaps a problem might prove worthy of a kaizen event.
- Perhaps a problem might need to be escalated to a higher tier of your lean management structure.
- Perhaps a problem might affect and be of interest to the larger value stream.
- If things aren't flowing, re-design the process for lean flow.
If your lean leaders don't actually solve problems as they surface,
then people will quickly lose interest, and wonder why they're doing all this
extra busy work to identify even more problems that management ignores.
Every lean tool needs
a corresponding
Lean Coaching System
If it is to succeed,
every lean production system must be implemented with a corresponding lean management system
and the most obvious elements
of your lean management systems
are your visual controls
Visual Management Board
The most common element of a visual management system is a Team Board
Three Types
of Visual Management Boards
1) Team Accountability Board
Use your SQDC template for highly visual, motivating headers for each column of your Team Accountability Board
As suggested in your Leader Standard Work template, (LSW.xlsx)
each Team, Supervisor, and Value Stream should have its own bulletin board located very near the place where the actual work is done.
This Team Accountability Board displays the team's most important visual information, and also serves as the agenda and meeting location for the team's stand up meetings.
The format and contents of each team's Huddle Board can vary greatly.
Common elements often include:
- Printed charts
summarizing the most important Key Performance Indicators.Charts must be kept current — often printed daily,
or even more often for particularly time-critical data - Sticky note based tracking systems — for Task Assignments and/or Suggestions.
Balance between
Computer and Sticky Note Tracking Systems
We at Systems2win are more computer-oriented than most, but we really like the sticky note based Accountability Board tracking systems for both Task Assignments and Suggestions as described in Chapter 5 of David Mann's book, Creating a Lean Culture.
We like them for their simplicity, accessibility, visuality, and the "fingerprint" factor of keeping the task or suggestion in the person's own words and hand writing.
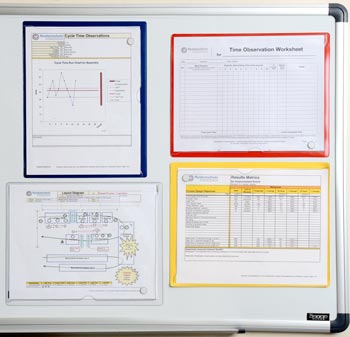
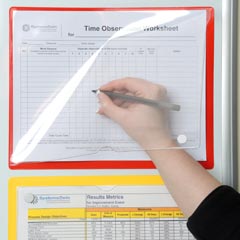
Many teams, however, like to also publish printed copies of project status reports on their Team Accountability board — usually sliding the latest printed report into a transparent document-holder sleeve.
You can purchase a wide variety of transparent document holder sleeves from StoreSMART.com
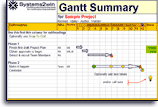
The Team To Do List and Excel Gantt Chart and Value Stream Plan templates can be a powerful supplement to a Team Accountability Board, by providing easy, field-proven ways for the Team Leader to:
- Have well-organized 'parking lot' systems
to store (and later actually come back to) suggestions and tasks that are not high enough priority to be front and center on the sticky note Accountability Board — which should remain uncluttered — with only high priority tasks and suggestions that are actually being considered or implemented now
- Organize longer-term plans for more complex multi-phased projects
providing field-proven structures for breaking complex projects into bite-sized Work Breakdown Structures — which the leader can then release in the form of a visible sticky note at the precise moment that the team needs to do something about it
- Archive completed tasks
We agree that it is good motivation to leave completed sticky notes on the Accountability Board for a period of time — so that the team feels the satisfaction that comes from seeing all of those green round stickers — but at some point, the board will need to be cleared to make room for the even greater accomplishments that just keep coming.
2) Process Observation Point
A Team Accountability Board often doubles as a 'Process Observation Point' or 'Visual Observation Station':
A designated place to easily observe the process.
Although a Process Observation Point might also have visual controls for quality, reliability, scrap, cost, pace, or any other Key Performance Indicators...
the most essential element that should be front and center in any Process Observation Point is a visual control that instantly indicates how well your product is flowing through that work area.
Acid test for Lean Flow
Invite someone unfamiliar with the work area to stand at the clearly-marked Process Observation Point,
ideally with no further instruction, but perhaps with a brief explanation for:
1) how to read your at-a-glance visual control chart that makes heijunka flow visible for this process
2) how often it is updated — which usually coincides with your Pitch Pulse Cycle
(which is measured in hours; not days)
and then ask...
Is this process flowing as expected?
The answer should be either yes or no... red or green... no yellow.
Learn more about why this is the ultimate acid test for your entire lean transformation
3) Lean Storyboard for Visual Management
aka PDCA Storyboard, Improvement Kata Storyboard, Learner's Storyboard
As popularized in the book The Toyota Kata, by Mike Rother,
a Learner's Storyboard is a special type of Team Accountability board
to facilitate and guide interaction between Learner and Coach,
and to visually tell the story of the progress of a rapidly-changing PDCA project.
| Lean Learner's Storyboard | ||
|---|---|---|
|
Focus Process <Title> |
Strategic Challenge <Brief, compelling vision statement that almost never changes> See guidelines for how to phrase your Strategic Challenge |
|
Target Condition Achieve by: <date> <Brief description See online training  |
Current Condition See online training 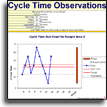  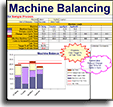 |
PDCA Cycles Record See online training |
Obstacles Parking Lot Unprioritized list
of things that you (You focus on only one obstacle at a time) |
||
Sample Lean Storyboard example — in the format suggested for Toyota Kata Coaching
(publish on a large bulletin board)
Your PDCA Coaching template provides a standard format
that can be used throughout your organization
If you have physical space for 2 separate storyboards near the same process,
then you might decide to follow the Learner's Storyboard approach exactly as taught in The Toyota Kata, using the PDCA template only in the section of the Learner's Storyboard for PDCA tracking.

If you use the Systems2win PDCA Coaching template, however,
it does already incorporate every element of the Improvement Kata Storyboard,
so some Coaches might find it sufficiently visual, (and easier) to simply publish that normal-sized working document in a transparent sleeve on your (already-existing) Team Accountability Board (described in the section above).
Perhaps a single sleeve to hold the stapled multi-page PDCA Coaching document, or perhaps multiple sleeves to show each page.
Perhaps supplement the (abbreviated) Current Condition section with a more detailed Process Analysis document.
Other Coaches might want to make things even more visual
by supplementing the report with some personalized format for some large-print or graphic progress summary on their own personalized Team Accountability Board.
The point is that there's not just one "right" way to communicate your Lean Storyboard.
The important thing is to incorporate all of the essential elements —
and make it visual.
"Eventually your organizationʼs storyboard design may evolve to suit your environment and culture. But try to keep a standard storyboard format across your organization, so coaching and communication are easier.
Having a common format for the Learnerʼs storyboard makes it easier for the Coach to go from one Learner to the next."
Mike Rother ~ Author of The Toyota Kata
Vinyl casings from StoreSMART.com
Suggested Reading and Resources for
Visual Controls
- Creating a Lean Culture, by David Mann
- More suggested reading & resources
Visual management toolswith lean management templates, kaizen tools, project management tools, load leveling templates, strategic planning tools, and A3 Problem Solving tools
to empower every team member to improve every process
|
Contents
Download Free Trial
Download free trials
of Systems2win templates
No, we're not going to
buy you any tools...
but we don't want any excuses when those deadlines are due
Own Yours Now
Own your own professional tools
that you can take with you for the rest of your career
Training and Coaching
Consider Training and Coaching to support your teams to succeed
Training to get you started.
Tools you won't outgrow.
Schedule a Conference
Schedule a conference
to discuss your challenges
with an experienced lean advisor
150+ Templates
Try Some
Own Them All
Download Trial Now
Get a dozen trial templates,
and another dozen free gifts
@@@ Better conversion rate
if call to action is for a specific tool, and shows the image
Try It
Try this template
along with a couple dozen more
process improvement tools
Calls to Action Botttom

Related Topics
Related Topics section WITHOUT TESTIMONIALS
Replace this paragraph with menu library item for topics related to this video
Training and Coaching
Consider Training and Coaching to support your teams to succeed
Training to get you started.
Tools you won't outgrow.
Schedule a Conference
Schedule a conference
to discuss your challenges
with an experienced lean advisor