
Process Improvement Tools.
Standard Work.
Work Instructions.
Flow Chart templates.
Swim Lane Cross Functional Flowchart.
Value Stream Mapping.
Lean tools.
Yamazumi Chart template.
Time Study templates.
DMAIC tools.
Quality Improvement tools.
House of Quality QFD.
FMEA Risk Reduction.
Root Cause Analysis tools.
Problem Solving tools.
OEE.
Preventive Maintenance.
Skip to main content


Installation and Setup
Installation - Each User. Installation - Multi-user. Language Translations. Personalize Your Templates.Systems2win Training.
Quick Start Initial Training. New User Training. Training Matrix. Systems2win Leadership. Training Classes.Lean Training
Lean Training and Coaching. Lean Principles. Muda 8 Wastes. Goal - Lean Flow. Roadmap - Lean Journey. Value Stream Mapping. Standard Work. Hansei Lean Thinking. Lean Dictionary. Online Lean Training. Lean Leadership.Microsoft Office Training
Excel Training. Excel Drawings (without Visio). Excel Charts. Word Training. PDF Training. Document Storage and Naming.Support
Support.Gantt Chart Excel template
aka Project Plan template, Project Management template
Purpose of a Project Plan template
To plan and manage a lengthy or complex project, illustrated with an easy-to-understand graphic time line bar chart.
Excel Gantt Chart template
Top 3 Features of your Gantt Chart Excel template
- All the familiarity of Microsoft Excel
- All of the Systems2win standard features
that come with every one of your other 150+ Systems2win templates
Consistent design, easily personalized, free training, videos, support...
- Work Calendar Adjustment
If you are working 16 days in December and 23 days in January, doesn't that affect your answer to the question:
"When can we have it?"
That's what Work Calendar Adjustment Factors do
(that no other Excel Gantt Chart can)
Sample Gantt Chart example
How to prepare to use your
Gantt Chart template
Find and open your template
Find and open your Gantt Chart template
(Gantt.xlsx)
in the same way that you find and open your other 150+ Systems2win templates.
If you don't yet own a license, you can download your free trial now.
Save your working document
following the usual document storage and naming conventions established by your leaders
Open a Blank Sheet
When you're ready to start doing your own real work...
click the button to 'Open a Blank Sheet'
Excel Ribbon > Systems2win tab > Open a Blank Sheet
This blank sheet is where you will do your real work
(not on the Sample sheet — which gives you sample data that is extremely helpful for learning how to use your new tool, but is the wrong place to do your real work)
Rename your new sheet.
If English is not your preferred language
Switch language, just like every Systems2win Excel template.
Edit your drop down lists
Edit the drop down lists on the DV sheet for your Team Roles, your available project Resources, your Status codes, your Work Calendar...
in the same way that you edit drop down lists for any Systems2win template.
Now your team is ready to start using your
Gantt Chart Excel template
Enter your header data
At the top of the page, enter Title, Author, and Revised Date.
Define your Project Start Date
Your Chart will only work correctly after you...
Enter 'Start Date' in the 'Total Project' row
Select Systems2win menu > Configure Chart
Tips: The sheet must be unprotected to use the Configure Chart button.
If your Project Start Date ever changes, then you need to do this again.
Choose your time units of measure
99% of users will use the defaults without changing anything!!!
To change time Units of Measure:
Effort
Simply edit the column header to be minutes or seconds instead of hours.
Start and End
1) Edit the column headers
(for example 'Time' instead of 'Date')
2) Change the format of all cells in the 'Start' and 'End' columns
Right-click > Format Cells > Number tab > choose a time format instead of the default date format
Choose your Default Work Calendar Adjustment Factor
For any row where you leave the cell blank in the column for 'Work Calendar Adjustment Factor', it will use the 'Default Work Calendar Adjustment Factor' that you choose (from the drop down list) in the top row.
What is a Work Calendar Adjustment Factor?
One limitation of an Excel Gantt Chart template is that you cannot define a detailed work calendar.
(In full-featured Gantt software, you can define exactly which days you will work, and which days are non-working weekends and holidays).
To overcome this limitation, your Systems2win Gantt Chart Excel template has a special feature called 'Work Calendar Adjustment Factors'.
By using Work Calendar Adjustment Factors, your Lead Time estimates can adjust for your working calendar - correctly reflecting your chosen working days, weekends, and holidays.
You can define an unlimited number of user-defined Work Calendar Adjustment Factors in the table on the DV sheet.
Go look at the examples pre-defined on the DV sheet, and you will quickly understand how they work.
Tip: If your working calendar never changes
(for example, you always work 5 days a week)
then (after choosing your Default Work Calendar Adjustment Factor), you can simply hide those 2 columns for WCA.
How to do project planning with your
Excel Gantt Chart template
After you have completed the preparatory steps above...
you are now ready to use your Excel Gantt Chart template to:
- Plan your project
- Control it as it changes over time
Create your Project Plan
Work Breakdown Structure
Use any line numbering system that makes sense for the structure of your project.
Tip: Experiment with Excel's Fill Series features
Phases and Milestones
Optionally use colors, fonts, and cell formatting to highlight Phases, sub-phases, and milestones
Task
BRIEF description of what needs to be done.
Effort Hours
The amount of effort time that will be required to accomplish the task.
In Lean terminology...
Effort = Processing Time
See Systems2win on-line training for Lean Time Definitions
Duration Days
The number of calendar days required to accomplish a task or phase.
In Lean terminology...
Duration = Lead Time
Enter two; calculate the third: End Date, Start Date, or Duration
For any row, you will enter data into 2 of these columns, and your template will calculate the third.
End Date, Start Date, or Duration
The default is to calculate End Date.
To calculate Start Date or Duration instead of End Date
- Delete the default formula in the column for End Date
so that there is not a circular reference
- Copy & paste one of the other formula cells from the Sample worksheet to your target worksheet
- Enter your data into the 2 columns that don't have the formula
Near the bottom of the sample data on the Sample sheet,
there are 3 cells that you can copy and paste to your target sheet —
to calculate Start Date or Duration — instead of calculating End Date.
Tip: In Excel, unprotected cells that contain a formula
are identified with a green triangle in the upper left corner.
Learn more ways to identify cells containing formulas.
Work Calendar Adjustment Factors
In the 'WCA' column for each row in your Gantt Chart, you can optionally use the dropdown list to choose which Work Calendar Adjustment Factor to apply.
It's easy to to change the WCA if (for example) a phase of your project that was originally scheduled for November slips into December.
Here is a summary of how WCA factors affect Lead Time calculations:
End Date = Start Date + (Duration * WCA factor)
OR... Start Date = End Date - (Duration * WCA factor)
OR... you can calculate Duration in one of two ways:
- DurCalc = (End Date - Start Date) / WCA factor
- DurNoWCA = End Date - Start Date
Precedents, Dependents, and Absolute Fixed Dates
Watch the training video
to learn how to use Excel formulas for precedents, dependents, and absolute fixed dates.
Example:
Start Date can be manually entered, or can be a formula based on some other start or end date.
Example: '=H9' would make this the same start date as row 9.
or '=I9+5' would make this start 5 days after the End Date for row 9.
Yes, (unlike Microsoft Project), you can use everything you know about Microsoft Excel formulas, thereby giving you more power than Microsoft Project to define complex relationships between Tasks that Precede or Depend upon the start or completion of other related tasks.
Advanced Tips for your Excel Gantt Chart
The Gantt Chart will be auto-created as you enter Start/End Dates and Durations
(as instructed above)
Rounding
Although start & end dates are usually rounded to display to the nearest date, the actual math (and Gantt bars) are precise to the minute.
Chart Alignment
Either open your Gantt Chart template in Excel, or scroll up to look at the sample picture above.
Notice that the first line of the chart is for the total project, the second line is blank, the third line of the chart needs to align with the first task, and the second-to-the-bottom line of the chart needs to align with the last task.
Tips:
As you add or hide rows...
you may need to manually adjust chart height to line up perfectly with your rows.
To make chart alignment easier, try toggling between options for 'Chart Labels'
and notice whether you may need to manually adjust the width of the Plot Area to show the labels.
Chart a 'Today' Line
On the Sample sheet...
if you change the 'Project Start Date' to a few days ago, and then select 'Systems2win menu > Configure Chart', the Today line will appear correctly in your chart.
Try it.
Comments and Links
For long Comments:
Option 1) Link to Comments in the Comments section (below the Gantt Chart data)
Remember... use the Anchor link icon to link to different places within your same workbook
Option 2) Right-click > Insert > Comment
Who
Define codes for your Project Team on the DV sheet.
Tips for Who codes:
It is usually best to use Titles or Roles, rather than people's names.
It is a good idea to have codes such as 'Unspecified Executive' or 'Unspecified Team Member' for roles that will be clarified in greater detail as the date gets nearer.
Resources
Define codes for your Project Resources on the DV sheet.
For example... your resources might include conference rooms, or fork lifts, or printers and plotters...
Cost
Cost = Quantity x Rate
Tip: To change the currency symbol: Right-click > Format Cells > Number
Filter
To analyze resource usage (Effort and Cost) by Who or Resource...
use Excel's Filter features.
Yes, this is another thing that your Excel Gantt Chart does better than Microsoft Project.
If you want to know how many Subtotal hours of Effort will be required by your Project Manager during the next 3 months of this project...
Video: How to use Excel Filter and dropdown lists
or how many Subtotal days of Duration...
or how much Subtotal Cost...
you can simply use Excel Filter.

Keep your Plan up to date
Make changes to your Project Plan as things inevitably change.
Time Saving Tip: To make it easier to manage your Critical Path you might define dates for only phases and milestones within your critical path and then simply make the start date for all non-critical-path sub tasks equal to the start date for the phase.
Hide or Show Rows
Optionally use Systems2win menu > Hide / Show Rows to quickly hide or show different levels of detail for different types of users of your Gantt Chart.
See training video for Hide/Show Rows
Enter % Complete and Status
and notice that conditional formatting still works correctly even if using different languages.
Optionally save baseline and/or archive versions
saving your copied workbooks using your Document Storage and Naming Conventions
Gantt Chart Excel Tips
Learn how to use Excel
A few of the most important Excel tips include:
- Don't use Insert Rows
Use the button to 'Add Rows', or Insert Copied Cells
- Don't move individual cells
which will corrupt formulas
Instead learn how to move entire rows
- Make sure that Microsoft Office is updated
You should always become familiar with the 'Excel Tips for THIS Template', which are always found near the bottom of every Help sheet in every Systems2win Excel template.
Don't skip this!!! Go look at those Excel Tips on the Help sheet now.
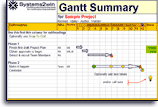
Gantt Summary Milestone Chart
A Gantt Chart is far too detailed for many stakeholders, who just want to see a brief summary of your project plan.
Your Gantt Summary Milestone Chart template (GanttSum.xlsx) provides an at-a-glance visual summary that is very easy to copy as a picture to your PowerPoint presentation or A3 Report
Or... if your project is extremely simple... you could even plan the entire thing using this simple tool.
Why more?
|
Reasons you might want to step up to more expensive Project Management Software | ||
| Comparison | Systems2win Excel Gantt Chart | Other |
|---|---|---|
| Define grid lines |
Yes, but using only whole numbers.
E.g. 7 days = a week. 30 days is close to a month. |
Yes. Advanced time-based grid line capabilities |
|
Header rows repeat at top of each printed page |
Yes but only for columns — not chart. Chart has axis labels at top and bottom |
Yes |
| Auto-numbering of complex Work Breakdown Structure numbers |
No Just use Edit > Fill Series for (automatic) simple numbering, or manually enter complex numbers |
Yes Auto-number options include outline format (e.g. 1.1, then 1.1.1) |
|
Select multiple colors for Gantt chart bars |
All Gantt chart bars will be the same two colors for complete vs. incomplete. You can, however define those 2 colors. |
Yes |
| Display predecessor relationships on the chart | No | Yes |
| Critical path analysis | No | Yes |
| Calendar view | No | Yes |
| Earned Value Management | No | Yes |
| Manage resources across multiple projects |
No Theoretically, you could use Excel formulas to do this, but if you are managing more than a couple of projects that need to share resources, you should probably step up to high-end Project Management software |
Yes |
|
If your projects are simple enough to manage without these advanced features, then why spend the extra thousands? |
||
This Excel Gantt Chart template comes with an entire suite of Project Management Tools for Continuous Improvement
Own all of these Lean Management Tools
to empower every team member
Download your free trial Gantt Chart
Contents
New User Training
Your Systems2win templates come with free New User Training
to quickly learn features that are common to all 150+ templates
Download Free Trial
If your organization has
not yet provided a license,
download your free trial now
Can we wait to start
this project?
I haven't finished
making my tools.
Own Yours Now
If your organization has
not yet provided a license,
own yours now
150+ Templates
Try Some
Own Them All
Download Trial Now
Get a dozen trial templates,
and another dozen free gifts
@@@ Better conversion rate
if call to action is for a specific tool, and shows the image
Try It
Try this template
along with a couple dozen more
process improvement tools
Calls to Action Botttom

Related Topics
Related Topics section WITHOUT TESTIMONIALS
Replace this paragraph with menu library item for topics related to this video
Training and Coaching
Consider Training and Coaching to support your teams to succeed
Training to get you started.
Tools you won't outgrow.
Schedule a Conference
Schedule a conference
to discuss your challenges
with an experienced lean advisor