
Process Improvement Tools.
Standard Work.
Work Instructions.
Flow Chart templates.
Swim Lane Cross Functional Flowchart.
Value Stream Mapping.
Lean tools.
Yamazumi Chart template.
Time Study templates.
DMAIC tools.
Quality Improvement tools.
House of Quality QFD.
FMEA Risk Reduction.
Root Cause Analysis tools.
Problem Solving tools.
OEE.
Preventive Maintenance.
Skip to main content


Installation and Setup
Installation - Each User. Installation - Multi-user. Language Translations. Personalize Your Templates.Systems2win Training.
Quick Start Initial Training. New User Training. Training Matrix. Systems2win Leadership. Training Classes.Lean Training
Lean Training and Coaching. Lean Principles. Muda 8 Wastes. Goal - Lean Flow. Roadmap - Lean Journey. Value Stream Mapping. Standard Work. Hansei Lean Thinking. Lean Dictionary. Online Lean Training. Lean Leadership.Microsoft Office Training
Excel Training. Excel Drawings (without Visio). Excel Charts. Word Training. PDF Training. Document Storage and Naming.Support
Support.Quality Improvement Tools
Also known as qi tools, quality management tools, or quality assurance templates
The Seven Basic Quality Tools
The seven basic tools of quality
Pareto Chart
Use your Pareto Chart template (Pareto.xlsx)
to identify the 20% of root causes for 80% of your problems,
so you know where to focus your continuous improvement efforts.
Easily enter or import either horizontal or vertical data.
Simply click the Copy Chart button to copy a picture of your chart to the clipboard where it can then be easily pasted to ANY other type of document.
(such as Word, PowerPoint, Visio, etc.)
Histogram
Use a histogram to graphically illustrate the probability distribution of something happening.
And to determine whether or not your data fits a normal distribution.
And to determine whether or not your process is capable of meeting your specifications.
XY Scatter Plot
Use a Scatter Plot Diagram to analyze the relationship between two sets of data.
For example, the relationship between the inputs to a process and the resulting outputs from that process.
One common use of a scatter diagram is the Stratification Diagram to make patterns visible when data is coming from a wide variety of sources.
Another is to attempt to evaluate whether there might be a correlation between the two sets of data.
Flow Chart
Your Systems2win templates empower you with several different types of flow chart templates, including:
- a simple flowchart to graphically illustrate "who does what", and what decisions to make along the way
- a cross-functional flowchart that has pre-programmed math, to answer the most common questions for process improvement
- many more types of flowcharts that you will find useful for specific challenges that you are likely to encounter as you progress on your Lean Journey
Check Sheet
Use your Check Sheet template (CheckSheet.xlsx)
to gather data when it happens where it happens, using hand written hash check marks.
Once your data is gathered,
you will usually want to summarize and analyze it
using your Trends Scorecard (Trends.xlsx)
which is designed to be very easily personalized using everything you know about familiar Microsoft Excel.
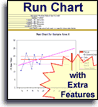
Run Chart / Trend Chart / Control Chart
The Run Chart (RunChart.xlsx)
is possibly the single most popular of the 7 quality tools,
and your Trends Analysis template (Trends.xlsx)
takes it to new levels.
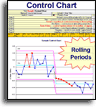
Your Control Chart template (ControlChart..xlsx)
allows you to choose between 3 special types of run chart
to determine whether a process is in a stable state of control.
An unstable process that is statistically out of control will exhibit patterns of variation (which will be highlighted in red) — to be investigated for possible 'special causes' — which should be systematically eliminated, so that the process becomes more and more stable.
Root Cause Analysis
aka Cause and Effect Diagram, Ishikawa Fishbone Diagram
Your Root Cause Analysis Mapping template (RootMap.xlsx)
Ishikawa Fishbone Diagram template (RootCause.xlsx)
and other Root Cause Analysis Tools make it easy to:
- Quickly record people's ideas as fast as they can generate them with "handwriting" that everyone can read
- Keep asking "why?" until you begin to arrive at the root causes for your problem so you can "dig out the roots" instead of "hacking at the leaves"
- Easily re-arrange ideas into logical groups, spawning even better ideas
And when the cause and effect analysis session is over, everyone (including the leader) can get right back to work, because everything is perfectly organized and ready to email to all team members, and to store electronically for future reference.
Additional Quality Improvement Tools
In addition to the seven basic tools of quality,
you and your team members are also empowered with many additional types of DMAIC tools, Lean tools, Six Sigma templates, and DFSS tools for more advanced quality management purposes.
Use your Tool Selection Matrix (1ToolSelection.xlsx)
to see all 150+ tools, and to use Excel's powerful Filter features to select the right tool for whatever you need to do next
If your organization has not yet provided you with a license,
you can download your free trial now
Standardized QI Tools
As soon as you complete the New User Training,
you will know how to use many features that are common to every one of your 150+ Systems2win templates.
You will leverage the value you squeeze from your quality improvement tools
- by becoming a whole lot more competent with familiar Microsoft Excel
- by becoming familiar with the many ways that your Systems2win add-in extends the power of Excel
Empower every one of your team members
with these seven basic quality tools
Standardized tools?
Oh no, man, everyone just
does their own thing
around here

Own Yours Now
If your organization has
not yet provided a license,
own yours now
150+ Templates
Try Some
Own Them All
Download Trial Now
Get a dozen trial templates,
and another dozen free gifts
@@@ Better conversion rate
if call to action is for a specific tool, and shows the image
Try It
Try this template
along with a couple dozen more
process improvement tools
Calls to Action Botttom

Related Topics
Related Topics section WITHOUT TESTIMONIALS
Replace this paragraph with menu library item for topics related to this video
Training and Coaching
Consider Training and Coaching to support your teams to succeed
Training to get you started.
Tools you won't outgrow.
Schedule a Conference
Schedule a conference
to discuss your challenges
with an experienced lean advisor