
Process Improvement Tools.
Standard Work.
Work Instructions.
Flow Chart templates.
Swim Lane Cross Functional Flowchart.
Value Stream Mapping.
Lean tools.
Yamazumi Chart template.
Time Study templates.
DMAIC tools.
Quality Improvement tools.
House of Quality QFD.
FMEA Risk Reduction.
Root Cause Analysis tools.
Problem Solving tools.
OEE.
Preventive Maintenance.
Skip to main content
Standard Work Template


Installation and Setup
Installation - Each User. Installation - Multi-user. Language Translations. Personalize Your Templates.Systems2win Training.
Quick Start Initial Training. New User Training. Training Matrix. Systems2win Leadership. Training Classes.Lean Training
Lean Training and Coaching. Lean Principles. Muda 8 Wastes. Goal - Lean Flow. Roadmap - Lean Journey. Value Stream Mapping. Standard Work. Hansei Lean Thinking. Lean Dictionary. Online Lean Training. Lean Leadership.Microsoft Office Training
Excel Training. Excel Drawings (without Visio). Excel Charts. Word Training. PDF Training. Document Storage and Naming.Support
Support.Standard Work Template
for Process Analysis
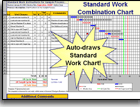
Standard Work Combination Sheet
for Standardized Work Instructions and Process Analysis
Your Standard Work Template
is 10 tools in one
- Standard Work Instructions
- Time Observation
- Layout diagram spaghetti map
- Value Add analysis & pie chart
- Operator Work Load Balancing & bar chart
- Standard Work Analysis for both the Shift Cycle and Run Cycle
- Standard Work Combination Sheet
- Change Over setup reduction
- TWI Job Breakdown for employee training
- Standard Cost estimating (has its own training page)
Page Contents
Why
How
- Standard Work videos
- Before getting started
- Initial data
- Time Observations
- Standard Work Instructions
- Process Analysis
Operator loads, Value Add Analysis, Shift or Batch Cycle Analysis, Run Cycle Analysis, Standard Work Chart
- Improve
Search
Use 'CTRL+F' to find keywords
within this training page
Why use your Standard Work template?
If you don't have standard work,
What's so wrong with backsliding into old habits?
then all of your other continuous improvement efforts will be fruitless, because people will simply backslide into old habits.
If you don't truly understand your process on a deep level,
then how are you going to know your true costs?
your capacity? (for different levels of customer demand)
If you don't know how your process is (actually, really) being done now,
then how will you guess what to try next to improve?
How will you know whether your experiments make any difference?
Standard Work Videos
All of the training on this page is summarized in these videos.
Getting Started - Initial Data
If you're just trying to get an idea of what this template can do for you, then you might want to preview the other videos first to answer the question:
"Why use this standard work template?"
When you've made up your mind to start actually using your template,
even if just the trial version...
do not skip the important first steps taught in this first video
Standard Work Video 1:
Getting Started - Initial Data
Time Observation
How long does this take?
Do we trust our numbers?
When we observe a new hire, is this the way she really does it?
How do we use Frequency Codes to handle things that don't happen every run cycle?
Think setups, inspections, change overs, etc.
How do we handle multiple operators doing the same thing?
Or one operator running multiple machines?
Standard Work Video 2:
Time Observation
Standard Work Instructions
How to prevent backsliding into old habits?
How do we show different levels of detail?
1) to analyze and improve a process
2) to train a new hire or vacation replacement
How can users easily drill down to greater levels of detail?
How do we handle sequence numbers? (especially when things change)
Standard Work Video 3:
Standard Work Instructions
Work Load Balancing and Value Add Analysis
Now that you have observed and documented your process, it's time to analyze the 'As Is' condition.
How to spread work between operators?
How will we re-shuffle for different levels of customer demand?
Which steps do our customers care about?
How much waste? What types? Best opportunities to reduce or eliminate?
Where should we focus our attention? What should we do next?
Standard Work Video 4:
Work Load Balancing
and Value Add Analysis
Batch or Shift Cycle Analysis
Will our plans meet our goals?
Will capacity meet demand? Is staff over-utilized? Will we meet our schedule?
What numbers should we plug in to our accounting software for 'labor', 'setup', and 'cost'?
To answer those questions, you need to analyze the entire Shift.
or... for the 90% of processes that are office, service, or medical (rather than manufacturing)... you need to analyze the entire Batch Cycle. (not just the Run Cycle)
Standard Work Video 5:
Batch or Shift Cycle Analysis.
Will our plans meet our goals?
Run Cycle Analysis
What's our smallest batch size?
Now? What if we did an improvement event to reduce setup times?
Can our machines handle this volume?
How close can we come to flow?
(and why is lean flow so important?)
To these questions, you will want to learn how to use a
Standard Work Combination Sheet
Standard Work Video 6:
Run Cycle Analysis
Improve
How to use all this (hard-won) analysis data
to make measurable lasting physical improvements to our process?
Note: You can take a sneak preview of the outline for the contents of the video that will be released soon.
The (more complete) written training is already there. It's just the video that needs to be completed. So there's nothing stopping you from improving your process... now.
Standard Work Video 7:
Process Improvement
Instructions for how to use your
Standard Work Template
for time observation, standard work instructions, and process analysis
Before getting started
Launch your team.
The same way that you launch any team.
Your team should be trained on the purposes of Standard Work,
as well as
the foundational Lean Principles and Ideals to improve any process.
Choose the right tools:
Your Systems2win templates come with several standard work templates
(for diverse types of processes, such as production, office, medical...)
and each process is often documented using more than one tool
(for different types of analysis, training new workers, auditing experienced workers... )
Your leaders should have already personalized your master template:
- Header fields
for document data personalized for your company
- Shapes and icons
for customized icons to communicate more visually
- Dropdown lists unique to your company
Most dropdown lists are defined on the DV sheet.
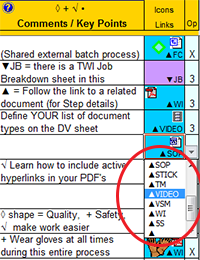
There is one more dropdown list near the bottom of the StdWk sheet, where you can define 'Frequency' codes, such as "Every other batch", "Three times per shift", or any other frequencies for your steps.
Do NOT edit anything about the first 3 pre-defined formulas in that list, for Run Cycle, Batch Cycle, and Shift Cycle.
Complete the New User Training
so that you know how to use features that are common to every Systems2win template.
Start entering...
Initial data for your
Standard Work Sheet
Start with this training video
Watch this training video
If you're just trying to get an idea of what this template can do for you,
you might want to first preview some of the other training & videos.
When you've made up your mind to start actually using your template,
even if just the trial version...
do not skip the important first steps taught in this first video
Standard Work Video 1:
Initial Data
Find and open your Standard Work template
Find and open your StdWork.xlsx template
in the same way that you find and open your other 150+ Systems2win templates.
Unlike most Systems2win Excel templates,
you will do most of your editing on the 'StdWk' sheet.
In this template, 'Systems2win menu > Open a Blank Sheet'
opens new TWI Job Breakdown sheets.
Each workbook will usually have only one 'StdWk' sheet.
If you don't yet own a license, you can download your free trial now.
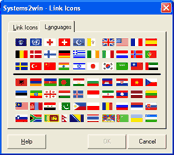
If English is not your preferred language
Switch to your language, just like every Systems2win Excel template.
Review the Excel Tips
Whenever you open any Systems2win template, it is a good idea to review the 'Excel Tips for THIS Template' section of the 'Help' sheet.
The more that you know about how to use Excel, the more value that you will get from an Add-in to Excel (like this one)
Easily switch between
languages
Define your Default Units of Measure and Data
Do not skip this step!!!
How can any math be correct
until you have defined your units of measure, work time available, and other defaults?
In the 'Instructions' section of the 'Help' sheet,
use the dropdown list to choose your desired
Cycle Time Unit of Measure
which can be seconds, minutes, or hours.
If you change Cycle Time Unit of Measure, then:
- you must change it first — before entering any other data
- you must manually recalculate the workbook
Defaults that you define on the 'StdWk' sheet
All other defaults are defined in the pink cells near the bottom of the 'StdWk' sheet
Unit of Measure for Work Time Available
Usually, you will use your Standard Work Template to analyze a 'Shift'.
You can, however, choose any other desired unit of measure for Work Time Available
(such as Day, Week, Batch, Periodic Lean Office Process Cycle...)
All the math still works, as long as you use the same unit of measure for 'Demand'.
(such as Demand/Day, Demand/Week, Demand/Batch, Demand/Weekly Lean Office Process Cycle...)
Lean Office or Service
It is extremely rare for any process in an office or service environment to fill an entire shift.
It is therefore extremely important to come up with the correct Unit of Measure for Work Time Available.
See the online training for Lean Office Flow
Total Hours Available
How many hours are available in your chosen Unit of Measure for Work Time Available?
(usually Shift)
Meal times are usually excluded from this starting number.
Breaks
Enter the default number of Break minutes per shift.
Meal times are usually excluded from Available Hours, and should not be double-counted here.
Unavailable Time
In any Systems2win template, there is a Custom Formula Zone where you can use everything you know about Excel to do any kind of custom math.
In this case, you might optionally use your Custom Formula Zone to answer the question,
"How did you come up with that number?"
for 'Unavailable Time'
Work Time Available
Gets calculated automatically —
based on the information you entered above.
Like every Systems2win template,
click any row or column header for pop-up help.
And for more thorough explanations, (and videos),
see the on-line Lean Glossary
The training in this section focuses on only
default data in the pink double-border cells.
For training on the calculated values,
see the section for Run Cycle Analysis
Unit of Measure - Demand
The unit of measure for both demand and production.
What is being delivered to the customer?
Demand per Work Time Available
How many units need to be produced during the Work Time Available?
Takt Time
Takt Time gets calculated automatically
(and uses the 'Cycle Time Unit of Measure' that was the very first thing that you entered in Step 1 above)
Personal Fatigue and Delay
A rough estimate of real world factors that prevent perfection
because people sometimes need to use the rest room, or take a phone call, or wait for their supervisor to deal with something before they can resume work.
In the United States, a PFD factor of at least 1.2 is required when paying piece work.
If you want to ignore 'Personal Fatigue and Delay',
then you can leave that field blank,
and simply hide that row.
Batch Size
To get started, enter the usual number of items produced
before needing a setup or change over.
You will come back to this number later (when you start to actually analyze and improve your standard work), but you might want to just plug in a few different numbers on the 'Sample' sheet now, just to notice how radically 'Batch Size' affects 'Out of Cycle Work', 'Run Time Available', and 'Takt Time per Run Cycle'.
It's never too soon to begin to understand and appreciate why Lean engineers are so obsessed with Batch Sizes.
Training to get you started.
Tools you won't outgrow.
Quantity per Run Cycle
If you make 1 unit per Run Cycle, then simply hide this row.
If your machine makes multiple units per Run Cycle, you will really appreciate this field.
Tip: If 1 machine makes 12 units at one pace,
and another older machine simultaneously makes the same units at a slower pace...
then use comments and/or the Custom Formula Zone to explain,"How did you come up with that number?"
Fill in the headers at the top of the page
Usually, you simply fill in data for the header fields at the top of the page.
If you want to personalize any of the default headings,
(for just your working document, not the master template, which is edited by your leaders)
then you can easily do that the same way as any other Systems2win template. Learn how
Optional: User-Defined Section
You can optionally unhide rows for the User-Defined section
(look for hidden rows below the 'Run Cycle Analysis' section, and above the Comments text box)
You can add unlimited rows to the User-Defined Section
- perhaps for all those 13 Approval signatures required by your company
- perhaps for your user-defined formula to calculate Operator Utilization (your way)
- or for anything else important for your standard work.
If you unhide the User-Defined section,
then those rows will also appear on the chart sheet when you select 'Systems2win menu > Chart Operators'
And, yes, of course, the Systems2win Personalization Upgrade Utility will automatically find and transfer your entire User-Defined Section to your new master template each time that you upgrade in the future.
Hide unused columns
In this section your Standard Work template, simply hide unused columns.
In this section of your Standard Work template, simply hide unused columns.
You will usually be doing one or the other: Time Observations or Estimating.
Hide the columns you're not using at the moment.
You will usually hide the section for Estimating
Estimating Standard Work times and costs
is an advanced tool for a mature lean process.
If you have not already gone to the gemba and observed this process many, many times,
then simply hide all of the columns for the Estimating section.
It's easy to personalize
your template
your way
Once your organization (and this process) have reach a high level of maturity,
then standard work estimating may prove extremely useful.
You will usually hide the Video section
Video time observation usually makes most sense for a very long process.
You will observe most processes using a stopwatch or a hand-held device,
so simply hide the columns for the Video section.
Hide unused Time Observation columns
There are columns for up to 10 time observations.
If you are only planning to do 6 observations (as shown in the example above),
then hide the unused columns, so that your form is uncluttered,
and easy to use for the way you plan to use it.
Go to the gemba, and observe your...
Standard Work Time Observations
Optional: Define your Operators
Operator Name
Scroll down below the 'Time Observations' section,
to the 'Operator' table, where you can optionally
document the name of the person associated with each Operator number.
Operator 'Level'
This allows you to arbitrarily adjust actual observed times.
Could be lower for a disabled worker, or a trainee
Could be higher for a superstar performer
If blank, formulas assume normal pace of 100%
Enter the Operator Number
For each row of data in the main section...
the first column is 'Operator Number'.
Every row of data must have data in this first 'Op' column.
The Steps performed by each Operator must all be together.
When you select 'Systems2win menu > Chart All Operators', the chart won't calculate or display correctly if the rows for Operator 1 are interrupted with rows for Operator 2.
For Steps performed by an External Operator
(such as the supervisor, an inspector, materials handler...
or anyone else who is not an operator 100% dedicated to this process)
For Steps performed by an External Operator, enter the number '-1' (minus 1) in the 'Op' column
(and notice that the cell is specially formatted so that -1 will then visually appear as 'X')
To learn more about how to handle Steps performed by an External Operator
see the Advanced Training for Special Situations.
Tip: Do not edit ANY cell that has a blue background color in any Systems2win template, because that cell contains a formula.
Observe Operator Process Time
In the 'Time Observations' section, enter your observed times.
Ensure that your observers are well-trained in every aspect of Process Observation Training.
Most importantly, they need a very clear understanding of
the definition of a 'Work Element':
Each Work Element starts & ends with a break point
where work COULD be handed off from one worker to another
And they should be trained to observe the process, not just time
Involving the people that perform the work, by asking them the questions on your 'A3 Gemba Interview' template
Option 1) Use a stopwatch
For any row, you can enter as many as 10 time observations.
Tip: Like any Systems2win Excel template, simply hide unused columns
You can either:
- Enter your time observations directly into your Standard Work template, or...
- Use a printed Time Observation Worksheet
and then transcribe your pencil & paper time observations into your Standard Work template
Option 2) Import from a hand-held device
- Export to a temporary Excel file (or CSV, or tab delimited text...)
- Open that temporary file in Excel, then copy & paste your time observations
Use Paste Special > Values
Time observations only. Let your Systems2win template do the calculations.
Note to long-time Systems2win users
In December 2015, the legacy StdWk template was replaced with the new StdWork template
In the old template, you used to record 'Walk' time on the same row with 'Work'.
This is no longer true. 'Walk' time is now recorded on its own row.
The main reason for this change is to make it easier to import time observation data from other (hand-held) applications.
Option 3) Use video time observation
When recording your video,
turn on the feature in your camera to display time (in seconds).
Enter the 'Start' time.
See the 'Sample' sheet for an example of the format that time data must be entered into Excel
When observing your video,
pause at each break between Work Elements, and record the 'End' time.
It automatically calculates the duration since the last 'End' time.
If your observation gets interrupted, simply enter a new 'Start' time.
If you Link to your video
Use an icon in the 'Links' column to link to (and automatically launch) your video
which is stored somewhere else on your network.
DO NOT embed a video within an Excel file, or your file size will be enormous.
Don't use Insert > Rows
In this template, never use 'Insert > Rows'
(because your new rows won't have formulas)
Instead, use the button to 'Add Rows', or copy a similar blank row using Insert Copied Cells.
And move entire rows using Insert Cut Cells.
To print the Time Observations section
Select Systems2win menu > Print Area 3
And you can change the Print Orientation for any of the 3 Print Areas (to choose between Portrait and Landscape) by using the dropdown lists found to the right of the Pictures and Charts section.
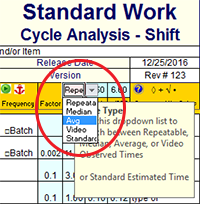
Choose which type of time to use for your analysis
In the pink cell just above the 'Time' column header, use the drop down list to select either:
- Repeatable
2nd fastest observed time.
This is the most commonly recommended way to use observed times for process improvement. - Median Average
The middle value in a rank ordered list of the time observations.
- Mean Average
All of these formulas auto-adjust for the number of time observations.
- Video
A good choice for very long, or remote processes.
- Standard
See training for Standard Work Estimating
a) to help define time and cost standards for your accounting and inventory software
b) to quickly see the difference between your standard and observed times and costs
c) to use this as an estimating tool for new product development or a deliver-to-order environment
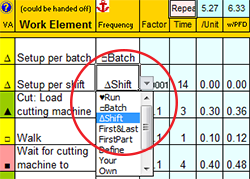
Enter Frequency Codes
Use Frequency codes to analyze process steps
that happen on frequency cycles other than 'every Run Cycle'
Some examples might be:
- Setup changeovers
between shifts and/or batches
- Product mix percentages
for a process that makes 70% Part A; 30% Part B
- Inspection, testing, palletizing, maintenance
or anything that happens on any frequency cycle
other than 'every time we make one unit of these''
See the training page for Frequency codes
Time Observation: Special Situations
External Operators
What is an External Operator?
Anyone who performs a Step, but is not an Operator 100% dedicated to this process.
Perhaps the supervisor, an inspector, materials handler...
For Steps performed by an External Operator, enter the number '-1' (minus 1) in the 'Op' column
(and notice that the cell is specially formatted so that -1 will then visually appear as 'X')
Understanding the relationship between External Operators and Wait Time
Steps performed by an External Operator
- are shown for informational purposes only
- are excluded from all calculations
If a numbered Operator (dedicated to this process)
has nothing better to do than wait
for an External Operator (or a machine) to finish doing something,
then in addition to entering a row
explaining what the External Operator is doing,
you also enter a row for the numbered Operator,
and in the dropdown list in the 'VA' column,
you select the '■' symbol for 'Wait'
Definition of Wait Time = the Operator has nothing better to do than Wait
for the External Operator (or a machine) to finish
Machines
Definitions:
Machine Time = time that a machine runs — unattended by the Operator.
Wait Time = the Operator has nothing better to do than Wait
for the machine (or an External Operator) to finish
In the 'Machine' column, enter the amount of time that any machine runs.
Machine time can be observed just once.
Machine time does NOT have its own row.
Enter Machine time in the same row with the Step that launches the machine to start running.
Wait time DOES have its own row.
See the Lean Glossary to learn more
Understanding the relationship between Machine time and Wait time
Standard Work Analysis is all about the Operator — not the machine.
Machine Time is only relevant to Standard Work Analysis when either:
1) the Operator has nothing better to do than Wait for the machine to finish
2) the Machine Cycle Time is greater than Takt time (or too close for comfort)
If any machine time is greater than Takt Time
(or too close for comfort)
Use your Machine Balancing template.
If you still have a problem, you will either:
Option 1) Divide the work between 2 work centers
Each with its own operator(s), and its own machine(s)
If each handles half of Demand,
then Takt Time becomes doubled for each.
Option 2) Have a single operator (or team) operate two machines
If both machines are identical, then double the 'Quantity Per Run Cycle'
If machines are different, use Comments or the Custom Formula Zone
to explain the number that you entered for 'Quantity Per Run Cycle'
Notice how changing 'Quantity Per Run Cycle'
does not change Takt Time,
but dramatically changes 'Takt Time Per Run Cycle'.
If you have one operator (or team)
running multiple machines
In addition to changing 'Quantity Per Run Cycle'
(as explained above)
the following training can also be helpful.
Make sure that you fully understand the definitions for:
Work, Walk, and Wait are sub-components of Process Time.
In other words - they answer the question,
"what is the operator doing?"
If an Operator loads Machine 1, and then starts it up,
and then the same Operator loads Machine 2 and starts it up, then those would simply be listed as Work Elements for Operator 1.
What can get confusing is "What number to enter for Machine Time?"
when a single Operator launches multiple machines that run in parallel.
There are 2 alternative ways of handling this:
1) Illustrate the combined Machine Time. (the time that ANY machine is running)
2) Don't illustrate Machine Time at all. Just focus on the Operator.
Remember: For Standard Work Analysis purposes, Machine Time is relevant only to the extent that it affects the Operator.
and then with either of these alternatives, use comments to explain Machine Time.
If you have multiple operators performing every step
(perhaps following each other in a circle through a U-shaped work cell)
Don't duplicate the Steps for each Operator.
Just show the Steps for Operator 1, and then make a note in Comments to explain that this process is scalable by simply assigning more operators. (Up to what maximum?)
And then manually override 'Workers - Actual'
In the small cell to the left of that row header, enter your override number.
Document your...
Standard Work Instructions
After you have entered your Time Observations,
your next step is to add more clarification for your Work Instructions.
Clarify your Work Elements
Definition of a 'Work Element'
A 'Work Element' starts & ends with a break point
where work COULD be handed off from one worker to another
Guidelines for 'Work Element' descriptions:
- Start with an action verb
- Short
Not detailed training
Standard Work Instructions are NOT intended to be detailed enough to
train a new-hire or vacation replacement to do every detail of this job
The level of detail should be only enough to:
- Remind an already-trained and competent Operator
of major steps and key points - Remind an already-trained and competent Auditor
of the major steps she should be observing - Succinctly describe each 'Work Element'
A 'Work Element' starts & ends with a break point
where work COULD be handed off from one worker to another
Does this guy look like he needs detailed training?
Rule: Most Steps should have (only) 1 row
The general rule:
One row per Work Element
How to provide more details without breaking the rule
- Word wrap
- Use the column for 'Comments and Key Points'
- Use a Comments text box
- Use cell comments
- A Job Breakdown sheet
- Links to related documents
- Icons
- A few pictures
How to bend the rule
- Sub-steps
- A lot of pictures
Word Wrap
You can use word wrap to enter up to 255 characters of text per cell, but
but rows have been specially formatted so that only the first 2 wrapped lines will appear.
You can manually resize row height on your Analysis sheet, (as many users do),
but notice that when you select 'Systems2win menu > Chart All Operators',
it will automatically resize the rows on that newly-generated Chart sheet
to show only the first 2 wrapped lines of text per row
(so that the chart is aligned with the rows)
It is usually best to keep your Work Elements and Key Points short
2 wrapped lines of text
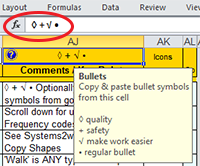
Enter Comments and Key Points
Key Points
It is a good idea to use visual bullets to highlight key points:
+ Safety factors
◊ Quality considerations that make or break the success or failure of the job
√ Tricks of the trade that make the job easier to do
How to copy bullet characters from the header field:
- Select the gold header field
at the top of the column for 'Comments / Key Points'(Use Freeze Panes to keep your headers visible as you scroll)
- Copy the special characters from the Formula Bar
Learn more about Key Points in TWI training
Long Instructions
Optional ways to provide long instructions:
- Refer to the Comments text box (on the 'StdWk' page)
- Use Cell Comments (that can only be viewed in Excel, not PDF or paper)
- Link to a related document (see instructions below)
- Refer to a Job Breakdown Sheet (another sheet in this same workbook)
Optional — Refer to a Job Breakdown Sheet
Perhaps the most popular way to provide your users with long instructions,
is to refer them to a Job Breakdown Sheet.
A Work Element that has only one short row on the StdWk sheet might have dozens of rows of details in its own Job Breakdown Sheet.
What is a Job Breakdown Sheet?
A Job Breakdown Sheet is a very popular way to provide "Instructor Notes" with sufficient detail to train a new-hire or a vacation replacement how to do a job well enough to prevent substantial loss of quality or productivity.
Only one Work Element per Job Breakdown Sheet
But you can have unlimited Job Breakdown sheets in a single Standard Work workbook.
Name your Job Breakdown sheets to obviously correspond with your Work Elements.
Examples: "Deburr", "Get tools", or "6" for Step 6.
To open a new Job Breakdown Sheet,
(a new worksheet within your same Standard Work workbook)
select 'Systems2win menu > Open a Blank Sheet'
And then in the dropdown list in the 'Links and Icons' column, select ▼JB
which turns the cell background color purple,
and serves as a visual signal to your users to go look for the Job Breakdown sheet
(see image in the next section for Links to related documents)
For training to use a Job Breakdown sheet —
See the online training for your Job Breakdown Sheet template,
and also see the Sample and Help sheets in your JobBreakdown.xlsx template.
Controlled and non-controlled worksheets (in the same workbook)
If your process is controlled by ISO 9001, or FDA, or any other controlling authority...
then it is forbidden to leave your Job Breakdown Instructor Notes with the worker — unless the document conforms fully with all relevant document control requirements.
It is, however, okay
to use a single Standard Work Excel workbook as the source document for both controlled and non-controlled sheets, and then release only the controlled sheets (usually as controlled PDF documents)
Optional — Links to related documents
You probably already know how to use
Systems2win menu > Insert Link Icon
to link to other related documents
for different levels of detail and different types of standard work analysis using different types of standard work templates.
In the 'Icons and Links' column,
you can also use the dropdown list to let the user know the 'Types of Related Documents' that they can drill down to
- Link to a related document
In the 'Icons and Links' column, use the dropdown list to select any of the types of documents that start with the symbol ▲
which turns the cell background color blue,
and serves as a signal to click the Link Icon to open the related document - Refer to a Job Breakdown Sheet
In the 'Icons and Links' column, use the dropdown list to select ▼JB
which turns the cell background color purple,
and serves as a signal to look for a Job Breakdown Sheet within this same workbook
Tip: You can define your own dropdown list
of the types of documents that your users might drill down to
Tip: to minimize the risk of breaking hyperlinks between related documents,
you will ideally store most related documents in the same folder with your Standard Work document —
as explained in our training for Document Storage and Naming Conventions.
Optional — Icons
Standard Work Instructions should be as visual as possible.
In addition to the many standard icons provided by Systems2win for common Personal Protective Equipment and safety hazards, you can also easily personalize your master templates for your own industry-specific icons.
You can find and copy icon shapes from either:
- The 'Favorite Shapes' section
near the top of the StdWk page
- Systems2win menu > Copy Shapes
for shapes that are always available for any Excel document, perhaps including your own user-defined shapes
Optional — Pictures
As we have re-iterated several times...
Standard Work Instructions are not intended to provide a level of detail sufficient to train a new-hire or vacation replacement.
There are situations, however, when a picture can be very helpful
to supplement the words of your Standard Work Instructions.
You can use everything you know about Excel to include:
- Pictures (Insert > Pictures)
- Shapes (Insert > Shapes)
- Text Labels (Insert > Text Box)
- Pre-defined Charts (Drag them or copy them)
- User-defined Charts (Any kind of chart. It's Excel.)
To print the 'Pictures and Charts' section, select 'Systems2win menu > Print Area 2'
Optional — Layout Diagram
The most popular 'picture' is a Layout Diagram.
Layout Diagram
training and video
Your Systems2win Standard Work Template
provides two convenient ways to draw a Layout Diagram:
- Draw on the 'Layout' sheet, then use Copy As Picture
to paste your Layout Diagram to your 'StdWk' sheet - Draw your Layout Diagram right there
in the 'Pictures and Charts' section of your StdWk sheet
Advantages of Option 1:
- Your picture won't distort if you hide, unhide, move, add, or delete rows.
- You can easily resize the picture to zoom in on details
- The grid makes it easy to draw precise dimensions.
Enter Step Numbers (Last)
Wait to enter Step numbers —
until after all Time Observations are completed
Wait to enter Sub-step numbers (if any) —
until all details for your Work Instructions have been fleshed out
Optional ways to do Step numbering
- If Step numbers won't change
even if you rearrange Work Elements
(perhaps for different customer demand scenarios)
then your Step numbers can keep increasing even as the Operators change
(as shown in the example on the 'Sample' page of your template) - If Step numbers might change
when you rearrange Work Elements
(perhaps because Operators need to work together to complete some tasks)
then you can start a new sequence of Step numbers for each Operator
(and those Step numbers will be different for each workbook that you create for each demand scenario)
Only Work Elements performed every Run Cycle get a Step number
And not even all of those.
Rows that do NOT get a Step number include:
- Walk
- Wait
- Steps performed by an External Operator
- Sub-steps
Remember: If you include Sub-steps at this level of Standard Work Analysis,
then you are bending 'the Rule':The Rule = only 1 Step per Work Element
(the smallest increment of work that COULD be handed off to another Operator)
Standardized tools?
Oh no, man, everyone just
does their own thing
around here
Sub-steps
Most of your sub-steps should be for Walk and Wait.
For most sub-steps, (other than Walk or Wait),
it is usually better to drill down to a related document,
rather than cluttering up your Standard Work template
with too much detail.
For sub-steps, either:
- Use the # field — as shown in the sample illustration
- Use Step numbers like 1.1, 1.2, 2.1
Optional ways to use the # field
- Work Sequence — for sub-steps (and Walk and Wait)
- Work Station — the physical place where work is performed
- Leave it blank — (hide the unused column)
External Steps
Steps performed by an External Operator don't get either a Step or Sub-step number.
Steps performed by an internal Operator, but with a Frequency other than blank or Run usually don't have a Step or Sub-step number.
Remember, all 'Run Cycle' steps performed by each Operator need to be grouped together in order for the Standard Work Combination Chart to work correctly.
Therefore, any Out of Cycle Work steps performed by an Operator need to be listed either before or after the entire sequence of 'Run' steps for that operator — even if some of those steps happen somewhere in the middle of the Run cycle (on the occasional frequency cycle that they happen).
For this reason, it is usually best not to assign Step or Sub-step numbers to any step that has a Frequency other than the Run Cycle.
Having said that, however, it is your tool to use any way that works best for YOUR unique process.
Process Analysis
Now that you have observed and documented your process...
it's time to analyze the 'As Is' condition of your standard work,
with the goal to improve that same process to have less cost, higher quality, and faster delivery
Watch this video
Standard Work Video 4:
Work Load Balancing
and Value Add Analysis
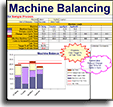
Operator Work Load Balancing
To move the Operator Load Balance Chart into the Print Area
Drag the chart into the 'Pictures and Charts' area.
(Or copy it. It's okay to have 2 copies of the same chart.)
The Operator Load Balance Chart
has been pre-programmed to chart as many as 50 operators.
If you need more than 50 operators, contact us to learn how.
As delivered, it displays the first 20 operators.
To display fewer or more operators,
scroll to the right of the Print Area,
and hide or unhide formula columns
for your preferred number of operators.
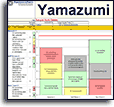
Perhaps also use your Yamazumi Board
When doing Work Load Balancing,
you might also want to use your Yamazumi Chart template,
which provides greater visibility of Work Elements,
and allows your team to quickly re-arrange Work Elements
for rapid-fire brainstorming of "what if" improvement ideas.
Tip: When copying data from from your Standard Work template to your Yamazumi template:
- Use Paste Special > Values, rather than regular Paste
- Copy only rows that have a Frequency of ♥Run (or blank)
How to move rows, or add new rows
Don't use 'Insert Rows', because your new rows won't have any formulas.
Instead, copy a similar blank row, using Insert Copied Cells, or Shift Down and Copy.
And to move rows, use Insert Cut Cells, or Shift Down and Move.
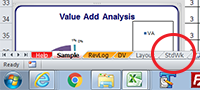
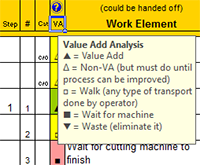
Value Add Analysis
In the Value Add ('VA') column,
use the dropdown list to choose the most appropriate code for each Work Element.
Your dropdown list choices include:
the same 3 codes used for Value Add Analysis in the Yamazumi chart:
▲ = Value Add (Your customer is willing to pay for it)
∆ = Non-VA (Type 2 muda. Must do until this process can be improved)
▼ = Waste (Type 1 muda. Pure waste. Eliminate it)
and 3 more options:
□ = Walk (any type of transport done by operator)
■ = Wait for machine
blank = Other
'Other' shows on the pie chart as '???'
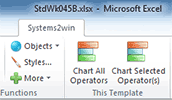
When you select 'Systems2win menu > Chart Operators'
notice that the Standard Work Combination Sheet separates Walk and Wait,
but combines all of the other codes into 'Work'
For unlimited user-defined types of waste
you can optionally Filter for your own user-defined 'Cat' codes
Optional —
Category Filters & User-Defined Columns
The optional 'Category' field
allows you to use Excel's powerful capabilities to Filter based on Category codes that you can optionally define on the DV sheet.
Most commonly,
use the 'Cat' field to filter to see the Subtotal for Work Elements related to Change Overs
You might also define Categories for the 7 Deadly Types of Waste,
and/or your own user-defined codes for the types of waste that you are seeking to eliminate.
If not used,
simply hide the 'Cat' column.
For more user-defined columns,
you can optionally unhide the User-Defined column (that is normally hidden),
and you can copy it to add unlimited columns for user-defined purposes.
allowing you to use everything you know about familiar Microsoft Excel
to personalize your template to include any and all standard work analysis that is important to you
Process Analysis
for a Shift Cycle or a Batch Cycle
Purpose
The purpose of the 'Cycle Analysis' section
(near the bottom of your worksheet)
is to answer the question:
Will your current plans will meet your goals?
Unit of Measure for Work Time Available
All formulas in this section are based on your chosen 'Unit of Measure for Work Time Available'
(usually 'Shift', but could be Day, Week, Batch, etc.)
To refresh your memory, you might refer back to the first section of this training,
where you learned how to enter your default units of measure in the pink double-border cells.
Watch this video
Standard Work Video 5:
Shift or Batch Cycle Analysis.
Will your plans meet your goals?
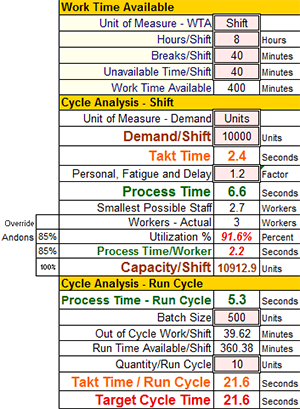
Takt Time
Your planning drumbeat.
How often completed units NEED to come out the end of the pipe — as established by customer demand.
Takt Time = Work Time Available divided by Demand
Process Time per Unit
Process Time = Time being worked on by any Operator.
Processing time is observed with a stopwatch or video camera — following one unit being processed by one operator all the way through the process.
Process Time/Unit = Divided by Demand
This Process Time/Unit
is also multiplied by 'Personal Fatigue and Delay'
As you learned in the first section of this training,
Personal Fatigue and Delay is an estimate of real world factors that prevent 100% productivity
Smallest Possible Staff
Smallest Possible Staff =
Process Time/Unit divided by Takt Time
Workers - Actual
This formula auto-populates with the Total Number of Operators.
If you want to override that default number...
(perhaps because an operator divides their time between this process and some other responsibilities?)
then don't overwrite the formula
Instead, enter your override value in the small cell to the left of the row header.
Process Time per Worker
Process Time per Worker cannot be greater than Takt Time, and therefore...
Process Time per Worker will turn bold italic red if greater than or equal to
Takt Time * the % that you enter in the 'Process Time Andon' field
(just to the left of the row header)
The number that you enter for 'Process Time Andon' should usually be 85-100%
Utilization %
Utilization = ((Process Time/Worker) * Demand) / Time Available
Utilization too close to 100% might require countermeasures to meet your schedule, and therefore...
This number will turn bold italic red if greater than or equal to
the % that you enter in the 'Utilization Andon' field
(just to the left of the row header)
The number that you enter for 'Utilization Andon' should usually be 80-100%
Capacity
Capacity = Work Time Available / Process Time per Worker
Capacity cannot be less than Demand, and therefore...
Capacity will turn bold italic red if less than or equal to
Demand * the % that you enter in the 'Capacity Andon' field
(just to the left of the row header)
The 'Capacity Andon' should usually be 100% or more
Capacity Assumptions:
- The ratio of Out of Cycle Work will stay consistent
To verify this assumption, perhaps analyze different scenarios for different Takt Time levels of customer demand.
- Work can be evenly divided among workers
To verify this assumption, you will want to 'Chart Operators',
as instructed below in the section for 'Standard Work Combination Sheet'.
Who needs standard work?
Standard Work Run Cycle Analysis
Purpose
The purpose of the next section is to analyze only those Work Elements that happen EVERY Run Cycle
stripping out the 'Out of Cycle Work' elements that have any other Frequency
(for example: shift changeover setup, inspection twice a shift, maintenance every other batch...)
The most popular reason for doing Run Cycle Analysis
is for SMED Quick Changeover Setup Reduction
which has its own training page
Process Time - Run Cycle
The sum of Process Times (per Unit)
for only those Work Elements
that happen EVERY Run Cycle
Frequency = '♥Run'
(or blank, which defaults to '♥Run')
Note: Run Cycle Process Time
does NOT include Personal Fatigue and Delay
There is no adjustment factor
for things that could go wrong that prevent perfection.
Batch Size
Batch Size is a pink double-border field,
which means that is one of the fields where you entered your initial data (as taught in the first training video).
You can enter different numbers for 'Batch Size' to see how all of the other numbers get affected, but you should use your Value Stream Mapping template to determine the Optimum Changeover Batch Size for (only) the Pacemaker process, which usually establishes the batch size for every other upstream and downstream process in the entire value stream.
Out of Cycle Work
Process Time (with Personal Fatigue and Delay) for anything that doesn't happen EVERY Run Cycle.
Work Elements with any Frequency other than '♥Run'
(or blank, which defaults to '♥Run')
Run Time Available
Run Time Available = Work Time Available
minus Out of Cycle Work
Just like Work Time Available, Run Time Available is displayed in minutes, but all calculations convert as needed
Like every Systems2win template,
click any row or column header for pop-up help.
And for more thorough explanations, (and videos),
see the on-line Lean Glossary
The training in this section focuses on only
the calculated values.
For training on the default data
(in the pink double-border cells)
see the section for Default Data
Quantity Per Run Cycle
'Quantity/Run Cycle' is also a pink double-border field (where you entered your initial default data).
If your process makes 1 unit at a time, then simply enter '1' in this field, and hide this row.
If you have any processes that involve machines that make more than 1 unit at a time,
then you will truly appreciate this field.
Takt Time per Run Cycle
Takt Time per Run Cycle = (Run Time Available / Demand) * Quantity per Run Cycle
Takt Time is your planning drumbeat.
How often completed Run Cycle batches NEED to come out the end of the pipe.
In layman's terms, 'Takt time per Run Cycle' is Takt Time adjusted for:
1) Adjusted for 'Out of Cycle Work'
Things that happen on any frequency other that 'Run Cycle'
will reduce 'Work Time Available' for the Run Cycle
2) Adjusted for 'Quantity per Run Cycle'
If your machine stamps out 10 units every Run Cycle,
you've got 10 times as much time available per Run Cycle.
Target Cycle Time
'Target Cycle Time' Is usually equal to 'Takt Time per Run Cycle',
but you can also manually adjust it for other factors of Sales & Operations Planning.
Use Comments &/or the Custom Formula Zone to explain any manual adjustments.
See Lean Glossary to learn more about the many types of Time used in lean process analysis.
Standard Work Combination Sheet
To chart the Run Cycle for your "As Is" process...
in the Systems2win menu in the Excel Ribbon bar, either:
- Select 'Chart All Operators', or...
- Select rows for just one or more selected Operators,
and then select 'Chart Selected Operator(s)'.
Do all of your editing on the 'StdWk' sheet
When you select 'Systems2win menu > Chart Operators',
the new chart sheet will have the same name as the originating sheet — appended with "-C".
Any editing that you do on a Combination Table (-C) sheet
will be overwritten the next time that a combination sheet is generated.
Tip: To avoid overwriting a standard work chart sheet,
you can rename it before generating a new chart sheet.
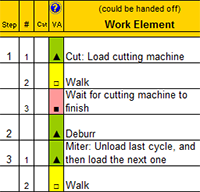
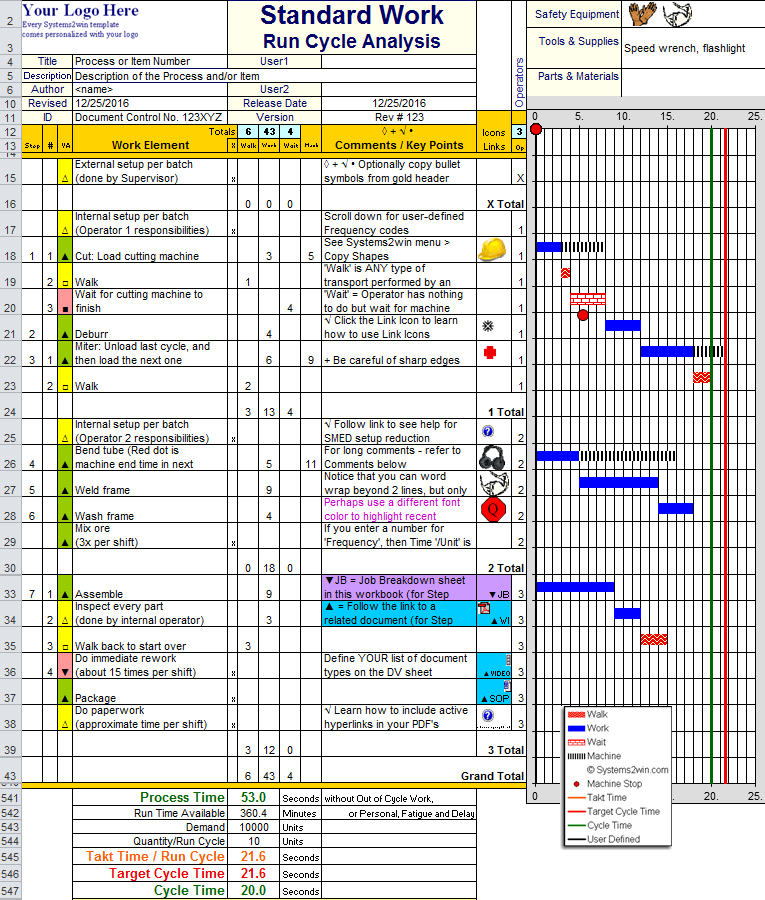
Sample Standard Work Combination Sheet Example
Things to know about your
Standard Work Combination Sheet
To precisely align the chart with corresponding rows
watch the video, and to learn more, you can also see chart training.
External Steps
Definitions:
External Step: (also known as 'Out of Cycle Work')
A step that has any Frequency code other than '♥Run'
(or blank which is the same as '♥Run').
Examples: Inspection twice per shift, palletizing every other batch...
In the illustration above...
rows 17, 25, 29, 36, 37, and 38 are examples of External Steps.
External Operator:
A step performed by someone other than
one of the Operators dedicated to this process.
Operator Number is entered as 'minus 1' (-1),
which then appears as 'X'.
In the illustration above... row 15 is an example of a step performed by an External Operator.
External Operators and External Steps show up on the Chart sheet as rows, but their data is excluded.
Why? Because your Standard Work Combination Chart is used for 'Run Cycle Analysis'.
In other words, it analyzes only those things that happen EVERY run cycle.
Once you understand this, you will appreciate how useful this tool can be
for SMED Quick Changeover Setup Reduction.
For example, you might do "what if" analysis...
What if we did a kaizen event to do this step as part of setup, rather than in the middle of the run cycle?
Keep External Operators and External Steps separated from Run Cycle Steps
Your chart requires all Run Cycle Steps per Operator to be grouped together.
External steps performed by an operator can be listed before and/or after that operator's Run steps.
Your Standard Work Combination Chart can display 2 to 500 rows of work instructions
(200 rows on older versions)
For very long processes with more rows, you have several options:
- Don't use chart sheets
The StdWk sheet can handle unlimited rows. Only chart sheets have limited rows.
- Chart Selected Operators
Perhaps 1 chart sheet per Operator.
Or perhaps split into 2 chart sheets for the first and second half of the very long process. - Split some sub-processes off into their own Standard Work Instructions workbook or worksheet
and then use Link Icons to quickly drill down to the related documents
and Link Cells to automatically roll up data from the related documents
If you have several StdWk sheets in one workbook…
Because the file size can get unwieldy, we usually recommend having only one 'StdWk' sheet per workbook,
but you do have the ability to
make one or more copies of your 'StdWk' sheet in the same workbook.
When copying the StdWk sheet, be sure to use the special Systems2win Copy Sheet utility:
Systems2win menu > Copy Sheet
How to copy a group of pictures from the Analysis sheet to the '-C' sheet
If you want a group of pictures to be automatically copied to the Standard Work Combination Sheet
when you select 'Systems2win menu > Chart Operators', then here's how to do it...
- Arrange your pictures, labels, and shapes
usually in the bottom-right corner of the 'StdWk' sheet beside the Comments text box, because that is where it will appear on the '-C' sheet.
- Then Group all the pictures & shapes together.
The maximum width of the grouped shape cannot be more than 6.75 inches wide.
How to resize an image.On the Sample sheet of your template, (shown in the illustration here),
notice that the Layout Diagram,
the 3 pictures, and the text box label within the center picture are all grouped together into a single grouped shape. - Select your grouped shape,
then name the entire group 'Layout'In the Name box (just to the left of the Formula Bar), type the word 'Layout' and then press the 'Enter' key.
Test: Save your document, (so that you can return to the current state if needed),
then select 'Systems2win menu > Chart All Operators'
Your grouped shapes should appear in the lower right corner of the '-C' sheet,
next to the 'Work Instructions Comments' text box.
Standard Work Process Improvement
Now that you have completed all of the above steps
to understand and analyze your 'As Is' condition...
you should now be ready to improve your process.
Copy the workbook
Because the Standard Work Template workbook is so big,
we recommend creating a separate workbook
for each version of the same process
following our usual suggested
document storage and naming conventions
If you ignore our advice…
and copy your StdWk sheet to serve as the starting point for your new version within this same workbook...
then at least be sure to use the special Systems2win Copy Sheet utility: 'Systems2win menu > Copy Sheet',
which eliminates several known bugs with Microsoft's usual way to copy a worksheet.
Standard Work Video 7:
Process Improvement
Ponder, think, reflect (hansei)
By far the most valuable step in any effort to improve any process
is to pause long enough to ponder, think, and reflect
about what you have seen as you observed the process,
what you have heard from the people who do the work
(both spontaneous comments, and answers to the questions you asked when you used your 'A3 Gemba Interview Questions' template)
The Japanese call this hansei.
We suggest that you plan your schedule to allow your team some quality time both alone and together as a team, to apply both unstructured meditation and structured team analysis exercises —
to focus the laser beam of your company's single most valuable asset
(your people's human intelligence)
to unravel the puzzle of how to make this process dramatically better than it used to be.
Establish systems for YOUR lean culture
How do you establish a culture? By establishing systems
where workers and process engineers work together to continuously improve your standard work methods to reflect the very best thinking and best practices that can be scientifically proven to minimize time and cost while maximizing quality and safety.
If ANYONE has a an idea,
there needs to be a quick, thorough, and fair evaluation of their idea using the scientific method:
to hypothesize, test, analyze, implement, and extend ideas for improvement
Every lean tool needs
a corresponding
Lean Coaching System
If the proposed method proves to be better,
you need teachable, repeatable lean management systems to teach the new better way to all other workers and to audit to ensure that everyone is actually doing things the agreed-upon best way.
Coach your people to communicate suggestions and ideas
The document Author is the only one authorized and responsible to edit the document.
Everyone else suggests ideas that are then accepted, rejected, or revised by the Author.
See online training for how to communicate with the document Author.
Use the Ideas text box
The 'Process Improvement Ideas' text box is located below the Print Area,
because you don't want to commingle ideas for possible future improvements
with your (perhaps ISO 9000 controlled) current best practice standard work instructions.
Whenever anyone comes up with an idea for how to possibly improve this process,
the document Author makes a note of that idea
in the 'Process Improvement Ideas' text box.
And then be sure to come back to those ideas at some point
to perhaps expand those ideas (perhaps using brainstorming techniques), and to apply decision-making tools and methods to sort out which ideas to implement now, or to remove from the list, or to keep on the list for possible future consideration.
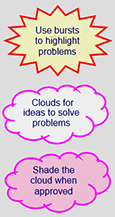
Use Clouds and Bursts
Use bursts and clouds to vidually highlight problems and ideas.
Improve the process
Use any of the dozens of continuous improvement tools and techniques available to you to Stabilize, Visualize, and Standardize your process.
Perhaps use root cause analysis,flow charting, spaghetti Mapping, brainstorming...
Perhaps launch a team, conduct a Kaizen Event, do some PDCA coaching cycles, or use the A3 Problem Solving method...
Process improvement is not a 'color within the lines' type of thing.
It is your responsibility to become familiar with the tools and methods available,
and then to creatively use some of them to improve your processes
in ways that are measurable, repeatable, and teachable.
Stabilize the process
A process is stable when
it is capable of safely producing a consistent output
that meets current customer demand on schedule, with consistent quality
If the results of your analysis reveal that your process is not stable
(another way of saying 'not stable' is 'out of control')
then... your number one priority is obvious and urgent...
Do whatever it takes to get your process under control
Learn more about how to stabilize your process.
Make Flow Visible
Using everything you know about lean visual management systems,
come up with creative ways to make flow visible.
Ensure that your process has a visual observation station that passes the Lean Transformation Acid Test:
Acid Test for Visibility of Flow
Invite someone unfamiliar with the work area
to stand at the clearly-marked Process Observation Point,
ideally with no further instruction, but perhaps with a brief explanation for:
1) how to read your at-a-glance visual control chart that makes heijunka flow visible for this process
2) how often it is updated — which usually coincides with your Pitch Pulse Cycle
(which is measured in hours; not days)
and then ask...
Is this process flowing as expected?
The answer should be either yes or no... red or green... no yellow.
And once your process has been standardized,
the bar gets raised for your acid test:
Anyone walking past that work area at any time
knows they can trust the visuals to be current and accurate
Road map for a typical
Lean Transformation
Re-Balance Operator Loads
For your revised, proposed 'To Be' condition...
assign each Work Element to an Operator,
ensuring that no Operator has a work load that exceeds Target Cycle Time.
Tip: When you select 'Systems2win menu > Chart Operators',
the chart will only look right if all steps are together for Frequency of 'Run Cycle'
(or blank which is the same as 'Run') for each Operator.
So you might need to move rows to group steps together
Reminder:
Don't use 'Insert > Rows'
Instead, copy a blank row
using Insert Copied Cells, or Shift Down and Copy
and move entire rows using Move Cut Cells, or Shift Down and Move.
Reduce Change Over Setup Times
The primary goals of SMED Quick Changeover Setup Reduction are:
- Reduce setup time
- Move tasks from 'internal' to 'external' (to the Run Cycle)
There are two ways that a Step will appear as an "external" line item
on the Standard Work Combination Chart,
excluded from both: 1) math totals, and 2) the bar chart
(because the Step is performed outside of the Run Cycle...
in other words it is an 'external' step.)
- Enter Operator Number as '-1' (minus 1)
- Enter a 'Frequency' code of anything but '♥Run'
(or blank which is the same as '♥Run')
In this way, your standard work chart still shows a line item for 'external' steps
that either happen infrequently, or are performed by an external operator
but all the math (and chart bars) correctly analyze
only those steps that are performed every time for every Run Cycle
Your lean objective
is throughput, not output
(Inventory that is sold,
not just produced)
(which makes this an extremely powerful tool for SMED Quick Change Over Setup Reduction)
Chart your improved process
In the Systems2win menu,
select 'Chart All Operators' or 'Chart Selected Operators'
Use the Revision Log
Whenever you make a change to a workbook that has a Revision Log:
- Make an entry in the 'RevLog' sheet.
- Save an archive copy of all old versions of your document —
following your company's Document Storage and Naming conventions.
Keep all related documents in sync
ALL documentation needs to be kept in sync:
These Standard Work Instructions, as well as any other process documentation and training documents such as Work Instructions, TWI Job Instructions, Layout Diagram, Standard Operating Procedures, training videos, visual work aids, etc.
Publish your Standardized Work Instructions
The whole point of analyzing and documenting Standard Work
is to change the way your people actually do their jobs in everyday real life.
Post your printed Work Instructions as near as possible to the place where the work gets performed.
Ideally where the worker can easily refer to it while doing the work.
Printing Tips:
Use 'Systems2win menu > Print Area1 - 3' to print the different Print Areas
How to publish as PDF. (Don't use the default PDF writing features in Microsoft Excel)
Learn more about Excel Print features
Train your people to do things the new way
If you've changed something about the process, take the time to teach your workers.
It is never sufficient training to just give your worker an updated version of Standard Work Instructions.
Perhaps using your Training Matrix template,
your Training Session Planning template,
TWI Training Within Industry methods,
and/or your other Lean Training templates.
Use your Lean Management Systems
Every aspect of any lean production system should also be supported by
a corresponding Lean Management System, often including Leader Standard Work.
Perform Standard Work Audits
Train & manage your supervisors to perform regular Standard Work Audits
using your Standard Work Audit template, 5S Audit template, Lean Assessment template...
It is one thing to thoroughly analyze and re-design a process on paper,
and it is another thing to ensure that things are actually being done as prescribed in the Standard Work Instructions.
Standard Work Audits also provide a systematic way to solicit and notice your worker's ideas for "doing things even better and faster",
and then formally incorporate those better ways into the Standard Work Instructions.
The relationship between
visual controls and standard work
The primary purpose of visual controls is to quickly and visibly reveal process abnormalities.
Any abnormality should prompt the following 3 questions:
- Did this happen because no standard work exists?
- Did this happen because the standard is incorrect or incomplete?
- Did this happen because someone didn't correctly follow the standard work?
Socialize your results
There are many reasons that you might want to let others know about the changes you have made:
- Your changes might affect others
End customers, downstream operations, upstream operations, supporting operations...
- The improvements you made might trigger others to make similar improvements
Others might generalize what you did, and do something similar,
perhaps in other facilities, perhaps in other operations in your own facility,
perhaps in your supply chain, perhaps in your trade association, perhaps anywhere -
It can be very helpful to your career
How are you ever going to get promoted
if no one knows the great things that you and your teams have done? - It can be very motivating
If you want more of something, reward it.
Give people credit. Honor them for being the heros that they are.
How to socialize your results?
Lunch and learns. Newsletter. Team boards. Stand up meetings. Bulletin boards. Industry trade shows....
The possibilities are limited only by your imagination.
When you are the author,
are you proud
of what you deliver?
And the documents you created using your Systems2win templates are impressive, legible, and shareable.
Unlike the poorly-lit snap shots of hard-to-read pencil drawings
distributed by some of your peers that might be competing with you for your next desired career move, your deliverables are representative of the professional that you are.
Standard Work template
with many other (simpler) Lean Tools
Download Free Trial
Download your free trial
Standard Work Combination Sheet,
which also has sheets for Spaghetti Layout Diagram,
and TWI Job Breakdown
Own Yours Now
Own All 150+ Templates for
Continuous Process Improvement
Every Systems2win Excel template is available in ANY language
Translations available for immediate delivery include:
Spanish: Instrucciones de trabajo estándar
Portuguese: Instruções de Trabalho Padrão
French: Instructions de travail standard
German: Standardmäßige Arbeitsanweisungen
Chinese: 标准工作说明
Own Yours Now
Own your own professional tools
that you can take with you for the rest of your career
Training and Coaching
Consider Training and Coaching to support your teams to succeed
Improve ANY process
in ANY industry
Schedule a Conference
Schedule a conference
to discuss your challenges
with an experienced lean advisor
150+ Templates
Try Some
Own Them All
Download Trial Now
Get a dozen trial templates,
and another dozen free gifts
@@@ Better conversion rate
if call to action is for a specific tool, and shows the image
Try It
Try this template
along with a couple dozen more
process improvement tools
Calls to Action Botttom

Related Topics
Related Topics section WITHOUT TESTIMONIALS
Replace this paragraph with menu library item for topics related to this video
Training and Coaching
Consider Training and Coaching to support your teams to succeed
Training to get you started.
Tools you won't outgrow.
Schedule a Conference
Schedule a conference
to discuss your challenges
with an experienced lean advisor