
Process Improvement Tools.
Standard Work.
Work Instructions.
Flow Chart templates.
Swim Lane Cross Functional Flowchart.
Value Stream Mapping.
Lean tools.
Yamazumi Chart template.
Time Study templates.
DMAIC tools.
Quality Improvement tools.
House of Quality QFD.
FMEA Risk Reduction.
Root Cause Analysis tools.
Problem Solving tools.
OEE.
Preventive Maintenance.
Skip to main content


Installation and Setup
Installation - Each User. Installation - Multi-user. Language Translations. Personalize Your Templates.Systems2win Training.
Quick Start Initial Training. New User Training. Training Matrix. Systems2win Leadership. Training Classes.Lean Training
Lean Training and Coaching. Lean Principles. Muda 8 Wastes. Goal - Lean Flow. Roadmap - Lean Journey. Value Stream Mapping. Standard Work. Hansei Lean Thinking. Lean Dictionary. Online Lean Training. Lean Leadership.Microsoft Office Training
Excel Training. Excel Drawings (without Visio). Excel Charts. Word Training. PDF Training. Document Storage and Naming.Support
Support.Value Stream Mapping Template
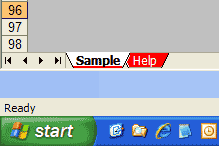
When you first open your Value Stream Mapping Excel template, (VSM.xlsx)
you will start on the 'Help' sheet,
that supplements the training on this web page.
Then open the 'Sample' sheet
that has sample data that you can play with.
If you don't yet own a license,
you can download your trial here
Video: Value Stream Mapping
Introduction to Training
Value Stream Map Template
This value stream mapping template comes with an entire suite of value stream mapping tools with features to help you Define, Measure, Analyze, Improve, and Control your value streams.
(not just draw them)
Sample Value Stream Map example.
How to use your
Value Stream Mapping Template
Learning experiments to learn to use your Excel Value Stream Map template
Find and open your template
Find and open your value stream mapping template
(VSM.xlsx)
in the same way that you find and open your other 150+ Systems2win templates.
Trial Template
If your organization has not yet provided a license, then you can download your free trial now.
Trial templates are fully functional for 30 days, and are fantastic for learning.
But you don't want to do too much real work on a trial template, because once you purchase your licensed version, you will need to transcribe your work from your trial to your licensed template.
So once you have played enough to have confidence that these tools will greatly leverage your continuous improvement efforts, you should throw away that trial template, and start doing your real work on your new power tools.
Save your working document
following the usual document storage and naming conventions established by your leaders
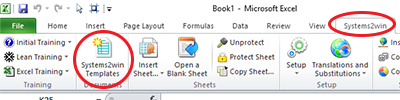
Open a Blank Sheet
When you're ready to start doing your own real work...
click the button to 'Open a Blank Sheet'
Excel Ribbon > Systems2win tab > Open a Blank Sheet
This blank sheet is where you will do your real work
(not on the Sample sheet — which gives you sample data that is extremely helpful for learning how to use your new tool, but is the wrong place to do your real work)
Choose which value stream mapping template to use
A window appears giving you the choice of:
- Simple - Just Draw
- Power Tool -
Draw, Measure, Analyze, Improve, and Manage - Supply Chain Map
If the scope of your Team Charter includes your suppliers, then consider using your Supply Chain Mapping template.
Otherwise, you will almost always use your VSM Power Tool.
Rename your new sheet.
Get Oriented
to the Value Stream Mapping training
for how to do the Value Stream Mapping Process
Now that you have your Value Stream Mapping template opened in front of you in Excel,
the first thing to do is to get oriented to the value stream mapping training that is available to get you started,
and how to quickly find training for advanced features when they become important to you.
Notice the menu for Related Topics
You will find the Related Topics menu on every training page related to value stream mapping, and it will help you keep track of where you are.
The top section of the sidebar menu
has links to training pages related to value stream mapping, where you will find answers to questions like:
- What's a value stream?
- What's a value stream map?
- Why do value stream mapping? What are the benefits?
- When should we do value stream mapping?
- When should we use sticky notes?
- When should we use our software?
- What do we do next?
Training to get you started.
Tools you won't outgrow.
The middle section of the sidebar menu
has links to learn about the Systems2win value stream mapping templates that make every step of the value stream mapping process so much easier
The bottom section of the sidebar menu
has links to training and videos for how to do advanced value stream analysis and value stream management
Make sure you're ready to use a value stream mapping template
If you're just becoming oriented to what's involved in value stream mapping
then that's great...
Download your trial, and just start playing and learning.
If you already own your Systems2win templates, and are ready to begin real-world value stream mapping
then follow the instructions for how to do Value Stream Mapping,
and when you get to the part where you are ready to start using your value stream mapping template, then come back to this page, and follow the instructions on this page.
(Optionally) change the language
If you prefer to use a language other than English, see our online training for how to easily switch between languages.
Translations available for immediate delivery include:
- Spanish: Mapeo de la Cadena de valor
- Portuguese: Mapeamento do Fluxo de Valor
- Chinese: 价值流图
- French: Cartographie de la chaîne de valeur
- German: Wertstromanalyse
If you have limited vision, or limited use of your hands
Learn how to use the special features for people with disabilities.
Get Oriented
to your Value Stream Mapping template
The Help sheet
Notice that when you first open any Systems2win Excel template, it opens to the 'Help' worksheet.
And every 'Help' worksheet is organized the exact same way, so when you learn how to find help for one Systems2win template, you know how to find help for ANY Systems2win template.
If this is the first Systems2win template you've ever used, take a few minutes to become familiar with what help is available on the 'Help' sheet, and how it is organized.
The QuickStart Training video will show you how to quickly find the help you need henever you need it.
Video: How to Find Help & Training for any Systems2win template
The Ribbon bar
In version 13, all macro buttons were replaced by menu items in the Systems2win menu in the Excel Ribbon bar.
The Sample sheet
Once you have familiarized yourself with the help available on the 'Help' sheet, you should be ready to start learning how to use your value stream mapping template.
And the fastest way to learn is to play with the sample data on the 'Sample' sheet.
Don't do real work on the Sample sheet
The Sample sheet is very useful because it has sample data that you can play with for faster learning,
but when you're ready to make your own value stream map, you do that on a blank copy of the Template worksheet not the Sample sheet.
If you skipped the Quick Start Training for how to use ANY Systems2win template, you should stop and review that now.
Once you learn how to use one Systems2win template, you know how to use them all.
Before doing anything else, it's probably a good idea to just take a look around the Sample sheet first.
Zoom
View > Zoom to adjust your value stream map to fit your viewing screen.
Notice that when you scroll, the top and left panes remain frozen, making it much easier to keep track of where you are on you map.
Perhaps also quickly review our other Viewing Tips which you will also find useful when using any of your other 150+ Systems2win templates.
Navigation links
Click the navigation links in the upper left corner to quickly take you to:
- Shapes
- Analysis and Charts
And then from those sections, click the 'Top' link to quickly take you back to the top of your document.
Hide/Show Rows
Click the button to 'Hide/Show Rows' to
quickly hide or show rows
so that you don't overwhelm your target audience with more answers than they have questions.
and easily unhide the correctly programmed lean analytics that become important as you round each next corner of your lean journey.
Add or Remove a Process
Click the button to 'Add or Remove a Process'.
Notice that it doesn't just add & remove the cell borders...
it adds and removes the correctly-programmed math.
Add or Remove Columns
Click the button to 'Add or Remove Columns'.
Notice that every column that contains a Process Box is paired with the column to its RIGHT.
And those paired columns are always kept together when you add or remove columns.
Unprotect and Protect Sheet
Click the buttons to 'Unprotect' and 'Protect Sheet'.
Notice that you don't need to unprotect the sheet
to copy unlimited rows of your own user-defined fields and formulas.
Pop-up Help
Click any row or column header and notice that you get pop-up help
(just like every Systems2win template)
And notice that there are also links to online training and videos, right there next to the row headers in the Critical Path section.
Have you ever watched someone new to value stream mapping try to figure out what they're looking at on a value stream map that doesn't have easily accessible training?
They ask questions like, "What does C/T mean?", or "How did it come up with than number?"
When you use any Systems2win template, help is always there with one quick click.
Play with Sample Data
Now that you are oriented...
Perhaps take some time to play with some of the sample data on the Sample sheet, learning how things work, before starting a new worksheet where you will begin YOUR value stream map.
Ready?
Make your value stream map
Open a Blank Sheet
If you haven't already...
select Systems2win menu > Open a Blank Sheet
(following the instructions already covered in the section above)
Rename your worksheet
Right-click the worksheet tab > Rename
You will usually name your sheet based on the State of your value stream
(e.g. "As Is", "As Was", "Current", "Future 1", "Ideal"...)
Define your Defaults
Do not skip this step!!!
How can any math be correct until you have defined your units of measure, work time available, and other defaults?
In the 'Instructions' section of the 'Help' sheet,
use the dropdown list to choose your desired
Cycle Time Unit of Measure
which can be seconds, minutes, or hours.
If you change Cycle Time Unit of Measure, then:
- you must change it first — before entering any other data
- you must manually recalculate the workbook
Defaults that you define on each sheet
In the Systems2win menu
On each worksheet containing a value stream map,
in the Excel Ribbon bar, select
Systems2win menu > Change Lead Time UOM
then in the window that appears, select your Lead Time Unit of Measure, which you can switch at any time between
- Working Days
- Calendar Days (including non-working days)
- Weeks
- Hours
In the row headers on the sheet for each value stream map
enter additional default values
in the double-border pink cells
See image
Tip: You might need to use the button to 'Hide/Show Rows'
to unhide all of the rows that have double-border pink cells where you enter optional default data
Tip: If you are still using an old version of the template,
default units of measure used to be defined on the 'UOMs' sheet
Demand Unit of Measure
This is the unit of measure for "the thing being transformed" which might be inventory, medical patients, paperwork, etc.
Choose the lowest unit of measure that is most commonly delivered to the end customer.
Example: If you make soda, the UOM could be bottle, or six pack, or 12 pack, but might more likely be case or pallet.
As explained in the video, each process can optionally have its own Process Unit of Measure.
Example: a process might make 4 'wheels' per 'go cart', and all the math is handled for you.
Video: Units of Measure
Workers
What do you call your workers? Staff? Employees? FTE's? (full time employee equivalents)
Tip: You might need to use your 'Hide/Show Rows' button to Show the rows containing the following optional defaults
Unit of Measure — Distance Within
This is usually a smaller unit of measure such as feet or meters.
This unit of measure is irrelevant for a Supply Chain Map.
Unit of Measure — Distance Between
This is usually a larger unit of measure such as miles or kilometers, but might be a small unit of measure for some value streams.
Currency
To change currency, simply use the dropdown list at the top of the sheet to select your preferred currency symbol, and then click the Currency button.
This will change the currency denomination for all money-related cells in the worksheet.
Because so many currencies use the same symbol, you can also use the pink cell in the Critical Path tier to clarify exactly which currency is used for this value stream.
The following defaults are defined in the pink cells in the Value column
Demand per Week
Enter weekly demand.
Even if your forecast uses some other time period, you must enter Demand per Week,
but then notice that the next row calculates Demand per your currently-selected Lead Time Unit of Measure,
allowing you to switch at any time between working days, calendar days, weeks, or hours
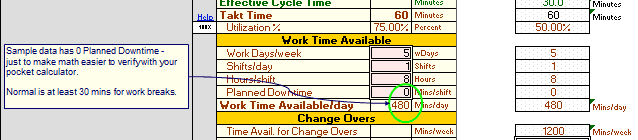
Work Time Available
In the pink cells in the Critical Path row headers, enter your default values for the elements of Work Time Available.
Pulse Batch Size
See the online training for Factors to Consider when choosing Pulse Batch Size.
Change Over Batch Size
When it becomes important, you can calculate your optimum Change Over Batch Sizes.
In othe words, how much time is available to do more frequent change overs, so that you can deliver exactly what your customer wants as quickly as she wants it?
What's your smallest optimum batch size? Let your template do the math.
Takt Time Calculator
After you follow the instructions above to enter your default data into the pink double-border cells, notice that your value stream mapping template automatically calculated:
- Work Time Available
- Takt Time
- Pitch Pulse Rate
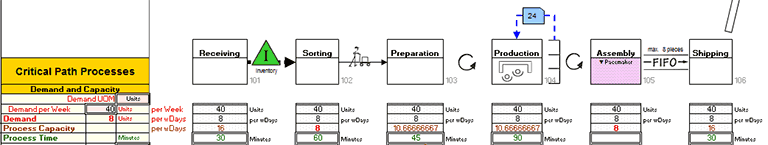
Define the segment of the value stream that you will be mapping
Define the boundaries of where this value stream map starts and ends.
Enter the process description in the first Process Box (in the first column of processes) and the last Process Box (in the last column)
Learn more about value stream segments and loops
Start working with your Process Flow Boxes
Your (very short) descriptions will often be just one word.
Examples: Deburr. Wash. Assemble. Ship.
or maybe two words: Gather Data. Enter Data. Admit Patient.
Because value stream mapping is done infrequently, it is a good idea to refresh everyone's memory by going over the definition of a Continuous Process Flow Box every time that you do another round of value stream mapping.
In a value stream map, as long as 'the thing being processed' doesn't stop flowing, you use just one 'Continuous Flow Process Box'.
This is very different from a similar-looking Process box in a traditional flowchart. See the online training if you need to refresh your memory.
Analyze and Improve your Value Stream
Learn how to use your value stream mapping template for Value Stream Analysis to Define, Measure, Analyze, Improve, and Control your value stream
(not just draw it)
The biggest strength of your Systems2win value stream mapping template is Value Stream Analysis,
which has its own training page.
When you're ready to print
You have all the power of Microsoft Excel to print on any size plotter that you own.
If you don't yet own a plotter, then perhaps change the Print Settings to print on multiple pages, which you can then tape together if your value stream map is too large to be readable on one small sheet of paper.
Keep your goals in mind
Now that your value stream map is completed, be sure to return to FINISH the instructions for how to do value stream mapping because your goal was not to "draw a value stream map", your goal was "to transform your value stream".
When done correctly...
the process of value stream mapping can be truly transformative
Transforming not only the flow of the things that you process,
but also transforming relationships between managers and employees,
between people who work on upstream and downstream processes,
between your company and your customers,
between your company and your suppliers,
between you and your surrounding communities and ecosystems,
and perhaps even ultimately transforming the foundational culture of your entire enterprise.
We hope you enjoy your journey, and we thank you for choosing Systems2win to be a part of it
Return to home training page for how to do value stream mapping
Contents
Download Free Trial
If your organization has
not yet provided a license,
download your free trial now
New User Training
Your Systems2win templates come with free New User Training
to quickly learn features that are common to all 150+ templates
Own Yours Now
Own your own professional tools
that you can take with you for the rest of your career
When to do Value Stream Mapping
in a Typical Lean Journey for Lean Transformation
- Phase 0)
Firefighting - Phase 1) Prepare Your Leadership
- Phase 2) Design Value Streams to Flow
- Phase 3) Analyze, Stabilize, Visualize, and Standardize each process
- Phase 4) Continuously Improve
Road map for a typical
Lean Transformation
Training and Coaching
Consider Training and Coaching to support your teams to succeed
Training to get you started.
Tools you won't outgrow.
Schedule a Conference
Schedule a conference
to discuss your challenges
with an experienced lean advisor
150+ Templates
Try Some
Own Them All
Download Trial Now
Get a dozen trial templates,
and another dozen free gifts
@@@ Better conversion rate
if call to action is for a specific tool, and shows the image
Try It
Try this template
along with a couple dozen more
process improvement tools
Calls to Action Botttom

Related Topics
Related Topics section WITHOUT TESTIMONIALS
Replace this paragraph with menu library item for topics related to this video
Training and Coaching
Consider Training and Coaching to support your teams to succeed
Training to get you started.
Tools you won't outgrow.
Schedule a Conference
Schedule a conference
to discuss your challenges
with an experienced lean advisor