
Process Improvement Tools.
Standard Work.
Work Instructions.
Flow Chart templates.
Swim Lane Cross Functional Flowchart.
Value Stream Mapping.
Lean tools.
Yamazumi Chart template.
Time Study templates.
DMAIC tools.
Quality Improvement tools.
House of Quality QFD.
FMEA Risk Reduction.
Root Cause Analysis tools.
Problem Solving tools.
OEE.
Preventive Maintenance.
Skip to main content


Installation and Setup
Installation - Each User. Installation - Multi-user. Language Translations. Personalize Your Templates.Systems2win Training.
Quick Start Initial Training. New User Training. Training Matrix. Systems2win Leadership. Training Classes.Lean Training
Lean Training and Coaching. Lean Principles. Muda 8 Wastes. Goal - Lean Flow. Roadmap - Lean Journey. Value Stream Mapping. Standard Work. Hansei Lean Thinking. Lean Dictionary. Online Lean Training. Lean Leadership.Microsoft Office Training
Excel Training. Excel Drawings (without Visio). Excel Charts. Word Training. PDF Training. Document Storage and Naming.Support
Support.Supply Chain Mapping
Supply Chain Management software. Supply Chain software. Supply Chain Mapping software.
How is supply chain mapping software different?
Anyone that has ever attempted to make a supply chain map knows...
the math is different
The symbols in supply chain software look similar to regular value stream mapping software
(which is used for mapping a value stream that is contained within the four walls of your own organization)
but the math is different.
Some of the math is similar
For example — takt time, cycle time, lead time, pitch, distance between...
If any of these terms are unfamiliar, you can refer to the on-line Lean Glossary and on-line training for Value Stream Analysis
And there is optional math
- Is processing time important?
- Is attention to value add time non-value-add itself?
- Effective Cycle Time? Distance Within?
And there is new math
Demand Screen, Quality Screen, Demand Amplification...
Supply chain math done right
With your Systems2win supply chain mapping tool, all of this similar, optional, and new math has been been (correctly) done for you.
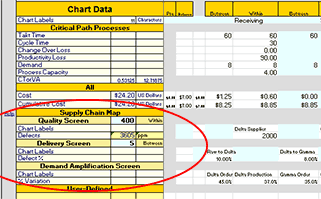
Supply Chain Map Example
Sample Supply Chain Mapping Example
Supply Chain Mapping is now in the VSM Template
As of version 13, the stand-alone Supply Chain Map template was discontinued, and all supply chain mapping charts and functions were merged into the standard Value Stream Mapping template.
Charts as Supply Chain Management Tools
When you read the book that introduced supply chain value stream mapping,
(Seeing the Whole Value Stream, by Dan Jones and Jim Womack)
you will notice that the most difficult new concepts (to both understand and program) are the charts that are especially useful for supply chain value stream mapping.
If you try to use entry-level value stream mapping software that does little or no math...
then you experience the pleasure of attempting to program these charts yourself.
When you use your Systems2win Supply Chain Value Stream Map...
the charts are pre-programmed and ready to use for Demand Screen, Quality Screen, Demand Amplification Screen, and more.
And because you are working in Excel, you can use everything that you already know about Excel to extend what Systems2win has started — by easily adding your own formulas and charts.

In addition to all of the standard charts for value stream analysis,
you can also optionally unhide 3 additional charts for supply chain management
Quality Screen
Quality Screen is a measure of defects WITHIN each of the processes in the supply chain.
(Often measured in Parts Per Million,
but you can optionally use a different unit of measure)
In addition to the chart... in the 'Chart Data' section, next to the 'Quality Screen' header, you will find the bottom-line 'Quality Screen' number:
Quality Screen = ppm defects farthest from customer divided by ppm defects nearest to customer (rounded to nearest whole number)
In the sample data, this number is 400, which was calculated as: 2000 ppm for Delta Supplier / 5 ppm for Alpha Supplier
Delivery Screen
Delivery Screen is a measure of defects BETWEEN each of the processes in the supply chain.
(Usually measured as a percent of units shipped that are found to be defective upon receipt)
In addition to the chart... in the 'Chart Data' section, next to the 'Delivery Screen' header, you will find the bottom-line 'Delivery Screen' number:
Delivery Screen = % defective shipments farthest from customer divided by % defective shipments nearest to customer
(rounded to nearest whole number)
In the sample data, this number is 5, which was calculated as: 10% for Raw to Delta / 2% for Alpha to Alpha Distribution Center
Demand Amplification Screen
The variability of order size increases as orders move up the supply chain (farther away from the customer), because each system recalculates its schedule based on its own (inherently inaccurate) forecasts based on incomplete and stale information from its downstream customers.
For full training on this concept, refer to the book Seeing the Whole Value Stream, by Dan Jones & Jim Womack — near the end of Part II.
Are you a supply chain captain?
After getting their own Lean act together, so many of our customers have told us that their suppliers became their weak link.
Why not stop complaining about "forces beyond your control" and start playing a leadership role to coordinate the efforts of your entire supply chain?
This template is not for beginners because supply chain management is not for beginners.
The assuring thing to know is that you can start with the easy tools in your Systems2win toolkit — and you can rest assured that you are mastering a toolset that you will never outgrow.
Supply Chain software in multiple languages
Probably more than any of your other 150+ Systems2win templates for continuous improvement, the Supply Chain template is most likely to benefit from language translations.
Click a button, and now the same template is in Chinese, now Portuguese, now French, now German, now Spanish...
Easily switch between
languages
Schedule a conference to see for yourself
Supply Chain Mapping Software
with many other Value Stream Mapping Tools
to empower every team member
The right tools to
Define, Measure, Analyze, Improve, and Control
your value stream maps
(not just draw them)

Tell a Colleague
150+ Templates
Try Some
Own Them All
Download Trial Now
Get a dozen trial templates,
and another dozen free gifts
@@@ Better conversion rate
if call to action is for a specific tool, and shows the image
Try It
Try this template
along with a couple dozen more
process improvement tools
Calls to Action Botttom
Related Topics
Related Topics section WITHOUT TESTIMONIALS
Replace this paragraph with menu library item for topics related to this video
Training and Coaching
Consider Training and Coaching to support your teams to succeed
Training to get you started.
Tools you won't outgrow.
Schedule a Conference
Schedule a conference
to discuss your challenges
with an experienced lean advisor