
Process Improvement Tools.
Standard Work.
Work Instructions.
Flow Chart templates.
Swim Lane Cross Functional Flowchart.
Value Stream Mapping.
Lean tools.
Yamazumi Chart template.
Time Study templates.
DMAIC tools.
Quality Improvement tools.
House of Quality QFD.
FMEA Risk Reduction.
Root Cause Analysis tools.
Problem Solving tools.
OEE.
Preventive Maintenance.
Skip to main content


Installation and Setup
Installation - Each User. Installation - Multi-user. Language Translations. Personalize Your Templates.Systems2win Training.
Quick Start Initial Training. New User Training. Training Matrix. Systems2win Leadership. Training Classes.Lean Training
Lean Training and Coaching. Lean Principles. Muda 8 Wastes. Goal - Lean Flow. Roadmap - Lean Journey. Value Stream Mapping. Standard Work. Hansei Lean Thinking. Lean Dictionary. Online Lean Training. Lean Leadership.Microsoft Office Training
Excel Training. Excel Drawings (without Visio). Excel Charts. Word Training. PDF Training. Document Storage and Naming.Support
Support.What's New?
Version 18 Latest Update
November 2021: Systems2win released an updated brand identity, with a new logo and color scheme, as part of our ongoing evolution of the company's brand.
Both our website and the full suite of 150+ Templates have been updated and improved to reflect this rebranding.
The renewed brand now reflects a much more simplified and modern design. This captures who we are as a company today and symbolizes our new focus for the future. Our mission is centered around innovation and continuous improvement in order to deliver a better experience for our customers.
Version 18 is the first step in our strategy to transform and digitize Business and Process Improvement tools and training!
Ready to Upgrade?
If you want to benefit immediately from hundreds of major improvements, Upgrade now!
UpgradePersonalization Upgrade Utility
Whenever you upgrade, the Personalization Upgrade Utility scans your old templates to automatically transfer most common personalizations to your new upgraded templates — so that you don't get stuck in an old version just because you made a few customizations.
Improvements across all templates
In addition to the many improvements to specific templates, this section includes other improvements which affect all templates in previous versions.
Also see Table of Contents
| Other Improvements Affecting All Templates |
|---|
Tool Selection Matrix 
November 2020. More ways to Filter to find the perfect Continuous Improvement Tool that your team should be using for the next steps to improve your process. The Tool Selection Matrix allows you to filter your tools in ways that are useful for your unique industry or organization: — based on your industry, team roles, what you are wanting to accomplish, who is most likely to use each tool, which tools are most likely to be personalized, and when each tool is most likely to be used on a typical Lean Journey. It also allows you to open templates by clicking links within the Tool Selection Matrix itself. |
Language Translations With click of a button, any Systems2win Excel template can now be in the language of your choice. Learn more about Language Translations. |
Version 17 Upgrade
November 2020 - All templates have been updated and improved: Improved formatting for performance enhancement, resulting in greater clarity and flexibility. This means formulas, filters, visual aids and measurements have been updated in templates such as 5S Standard, 5S Sustainment and TPM Preventative Maintenance, Issues and Ideas, Measurement Selection Matrix and Kanban Calculator. Insert Sheet and Link Cells - Improved training for how to Insert different types of useful templates sheets into ANY Excel workbook, and to Link the data so that your chart instantly updates every time that your data changes - without having to remember to manually refresh your chart. Systems2win is the only application on the market that has this ability to insert charts that instantly update as your data changes. Many new shapes in flow chart templates, such as the SIPOC Diagram, Process Flow Diagram and FMEA Process Flow Diagram. Improved training and guidance, including better examples and ideas in sample sheets throughout many templates, such as the Kaizen Event Agenda, Measurement Selection Matrix, PDCA Coaching template, Scatter Plot Diagram, Process Analysis template, Value Stream Product Family Matrix, Root Cause Analysis Map, Training and Skills Matrix, and the Multi-User Setup Checklist.
Gantt Chart: Updated Work Calendar Adjustment Factors to correctly adjust for working days and holidays, so that you can accurately answer your customer's question: “When can I have it?” Histogram: Ability to easily and instantly switch between a Relative Frequency Histogram (where the sum = 100%) and a classic histogram (based on the actual count of each category of incidents).
Standard Work: New option to supplement the standard Value Add codes with your own user-defined Value Add codes.
This flowchart does what Visio can’t! To use your flowchart to Measure, Analyze, Improve, and Control your process flows — then you're going to need math - to analyze things like lead time, queue time, steps, process time, value add time, cycle time, takt time, staffing requirements, and process capacity. |
Version 16 Upgrade
October 2019 - New 'Add Rows' button has been added to many templates — making it easy to add rows with the click of a button — correctly inserting new blank rows with correct formatting and formulas, and automatically unprotecting and re-protecting each workbook with correct protection settings (so that you don't accidentally damange formulas). This button has been added to the following templates: Swim Lane Cross Functional Flow Chart, FMEA, Standard Work, Gantt Chart, and Cause and Effect Matrix. February 2019 — New options for Lease To Own, and custom configured installation files. Faster processing, and elimination of several minor bug fixes. |
Version 15 Upgrade
December 2016 — Insert Sheet    About 30 of your 150+ templates now have the option to be either: 1) a stand-alone workbook (like all the other templates), or Simply click the button to 'Insert Sheet, and now your workbook has a new sheet. If you are the team leader, or a supervisor, or manager, perhaps you might want to insert a Team Charter sheet into your current workbook, or an Approvals sheet, or a Value Stream Plan, or an Action List, or a To Do List, or a Bowling Chart, or a Gantt Summary Milestone Chart, or a sheet to collect Issues and Ideas, or a Change Management sheet, or a Results Audit. If you are on the team responsible to produce measurable improvements, perhaps you might want to insert a Block Diagram sheet into your current workbook, or a Check Sheet, or a Flow Chart, or a Gemba Interview, or a Layout Diagram (Spaghetti Diagram), or Cycle Time Observations, or Muda Waste Observation, or a Pareto Chart, or Is Is Not Analysis, or a Process Analysis sheet, or a Root Cause Analysis Fishbone Diagram, or a Run Chart, or a SIPOC Diagram, or a Stick Figure Illustrator, or a Takt Time Calculator, or a Yamazumi Chart. If you need to train and coach your people to actually do things the new way, or a TWI Job Breakdown, or a Checklist, or Operational Definitions, or a Revision Log. Link Cells — New feature to extend Excel One of the most powerful features of Excel is the ability to link cells, so that the values in some cells get instantly updated the moment that the data changes in some other cells. That's one of the common complaints from users of Minitab, QI Macros, and Sigma XL... When you use any of those to create a Run Chart, or Pareto Chart, or any other type of chart, they don't use Excel's cell linking capabilities. So every time your data changes, you need to manually regenerate your chart. One of the reasons is because a cell linked to cell that has a blank value won't correctly display the blank value. This innovative new feature fixes that problem... so that now your charts can instantly update every time that your data changes. June 2016 — New piracy protection |
Version 14 Upgrade
September 2015 New way to open templates: * Open ALL templates through Systems2win menu > Systems2win Templates New sync: * The entire portal and every template is duplicated on each user's computer Easier installation: * After using another user's Administrator permissions, simply open an Excel file to automatically finish installation. |
Version 13 Upgrade
July 2015 — Templates are now in XLSX format, so you no longer need to enable macros when you open a workbook. |

Value Stream Mapping
Below is a list of the most recent improvements in some templates in VSM Tools and Methodology.
| Value Stream Mapping |
|---|

Value Stream Map March 2020. Improved mistake proofing. February 2018. Easier ways to calculate and analyze Lead Time, Queue Time, and Process Lead Time. Weekly Demand can now be converted to any time period (such as monthly or annual demand). Formulas now have intelligent rounding - to make analysis and comparisons easier. Several features have been added to more clearly analyze processes that have a Process Unit of Measure that is different from the default Demand Unit of Measure for the product or service produced by the value stream. For example, a process might produce 4 'wheels' per 'go cart', or 24 'bottles' per 'case'. Systems2win is the only value stream mapping software to correctly analyze these (very common) types of value streams, and now does it even better. October 2015. When you click the button to 'Open a Blank Sheet', you now have the choice of 1) Simple (just draw), 2) Power Tool (Draw, Measure, Analyze, Improve, and Manage, 3) Supply Chain Map. February 2015. Major upgrade to the Value Stream Mapping template. Major upgrade to value stream mapping training. New Design Guideline templates for VSM - Basic Design, VSM - Volume and Mix, and VSM - Shared Resources. |
 Value Stream Product Family Matrix November 2020. Improved training for how to perform Constrained Resource Analysis for any products that might take 30% longer than the Product Family average, and how to treat those outliers differently. |
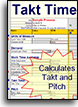
Takt Time Calculator September 2016. New Takt Time Calculator template to calculate Takt Time, Work Time Available, and Pitch. Has the option to copy the worksheet to any other Systems2win template, or to link to standalone workbook (perhaps from multiple related documents). |

Supply Chain VSM July 2015. The stand-alone Supply Chain Map template has been discontinued, and supply chain mapping functions and charts have been added as optional features within the standard value stream mapping template — that can be unhidden as needed. |
Lean Leadership
Below is a list of the most recent improvements in some templates in Lean Leadership Tools and Systems.
| Lean Leadership Tools and Systems |
|---|
5S 
 November 2020. Improved format on the 5S Standard template to better clarify expectations and workplace organization and housekeeping, and to serve as a “before and after” storyboard to socialize and share success stories of 5S workplace improvements. 5S Sustainment and TPM Preventive Maintenance templates - Even more visual and flexible format for a wide variety of types of Total Preventive Maintenance environments - to ensure that workplaces and machines are maintained on a regular basis to proactively prevent problems before they 'break down' and negatively affect both quality and productivity March 2018. Better system for comments and coaching for misses. July 2015. On the Scorecard sheet, when you click the button to 'Choose Source Data', the Comments text box next to the radar chart now auto-populates with your summary Comments for your chosen date in time. The 5s Assessment Template is also able to scale to 7S if desired. User-defined rating criteria can be defined using either simple text or User Substitutions, making it even easier to switch between different audit criteria for Office 5S, warehouse 5S, production 6S, etc. 3 tools in1:
Print the Trend Charts and Radar Chart Scorecard to publish on your Team Accountability Board — to motivate your team members to continuously improve their 5S workplace organization. |

Gemba Interview November 2020. Updated questions to ask the people performing the work, as you are performing time observation and/or process observation. This helps to ensure that they don't just silently observe and take notes. It is better to ask idea-stimulating questions that allows them to be actively involved and engaged in the effort to improve the process that they personally perform. The Gemba Interview template is used to systematically encourage both the observer and the process worker to come up with creative ideas for how to realize Lean Ideals by applying the 4 Rules In Use |
 Process Analysis template November 2020. Improved help and examples for how to systematically evaluate objective and subjective measures of success to assess whether or not each of your process improvement projects has (or has not) accomplished the anticipated measurable results for each of your chosen Process Design Objectives September 2016. New Process Analysis template to easily hide and unhide popular lean metrics, and easily add unlimited rows of user-defined metrics, (using everything you know about familiar Microsoft Excel) for the Key Performance Indictors (KPI's) that are most important to measure, analyze, and improve for your unique process. |
SQDC Header Sheets for your Team Huddle Boards November 2020. Additional options for international currency symbols for the center of your team huddle board monthly tracking of Cost Objectives. December 2016. Your Daily Stand Up Meetings are so much more motivating when the header sheet at the top of each column of your Huddle Board is an intuitive visual success tracking system.
|
 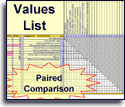 Values List and Prioritization Matrix October 2020. For both the Values List and Prioritization Matrix templates, you can now compare and prioritize up to 50 alternatives (instead of 24). Improved online training and data entry mistake-proofing. These 2 templates cover both ends of the spectrum to choose between competing priorities. Use the Values List for drop-dead-simple Forced Choice Paired Comparisons. (If you had to choose this or that, which would you choose?) And use the Prioritization Matrix to perform detailed numeric justification for the biggest decisions that you and your teams will ever face your careers. There are so many similar examples within your suite of Systems2win templates... providing you with fill-in-the-blanks tools and online training for both: 1) A really quick and easy way to do it, and 2) A really thorough way to carefully consider all factors Learn more about the Values List Worksheet |

Leader Standard Work March 2018. Major upgrade. Excel Leader standard work template allows each leader to easily personalize their own standard work, using standardized tools and systems that will be especially valuable to large global enterprises. |
Lean Assessment 
March 2018. Improved assessment criteria better match online training for a typical lean journey for Lean Transformation. Better system for comments and coaching for misses. Ability to hide any sections in the middle (not just the end). July 2015 . On the Scorecard sheet, when you click the button to 'Choose Source Data', the Comments text box next to the radar chart now auto-populates with your summary Comments for your chosen date in time. The Lean Assessment template to periodically assess the progress of your lean journey. |
 Quadrant Chart July 2017. Highlights duplicate XY values that will overlap on the chart. New column for optional long Notes, to make it easier to keep your Chart Labels short. Improved training and sample data for how to handle situations that are commonly encountered. This template is used to visually understand relationships between any two factors affecting an issue. Popular for Plan-Results, Importance-Performance, Effective-Achievable Analysis, and more. Learn about the many different types of quadrant charts. |
 Muda Observation September 2016. New Muda Observation template to observe the 8 Types of Waste. |


Lean Training Tools
Below is a list of the most recent improvements in some templates in Lean Training Tools and Methodology.
| Lean Training Tools |
|---|
Skills & Training Cross-Training Matrix
November 2020. Better help for your leaders to get your teams off to a successful start with their new Systems2win tools for process improvement. November 2019. New columns and improvement formatting — in response to feedback and ideas from our many customers using this tool in so many diverse ways. We really do value and respond to your ideas. Keep them coming! July 2016. New features to make it easy to fulfill your Leadership Roles to track who needs to be competent with which lean tools and methods, and how are they coming with that? |
Quality Improvement tools
Below is a list of the most recent improvements in some of the templates in Quality Improvement Tools and Methodology.
| Quality Improvement tools |
|---|
 Histogram November 2020. Ability to easily and instantly switch between a Relative Frequency Histogram (where the sum = 100%) and a classic histogram (based on the actual count of each category of incidents). January 2017. Excel Histogram to visually show and analyze the shape of the frequency distribution of your data, to determine whether or not the data fits a normal distribution curve, and to evaluate whether your process is capable of meeting your specifications. |
 Pareto November 2020. The Pareto Chart now has the improved ability to handle large volumes of data, (either vertical or horizontal), correctly grouping all low-incidence occurrences into a single bar called 'Other'. |
 Process Flow Diagram November 2020. More flowchart shapes in both the Process Flow Diagram and FMEA Process Flow Diagram. May 2019. The Process Flow Diagram has been updated to support the new FMEA format for much more clarity of the inter-relationships between the Process Steps, and their Parent and Lower-Level Requirements. August 2015. Can now be an optional worksheet within the FMEA workbook. Find out how to use the Process Flow Diagram template to identify Sources of Variation, and desired Deliverables (ideal Functions) for each Process Step. |
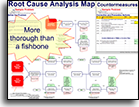 Root Cause Analysis Map November 2020. Clearer guidance for when to use a traditional Fishbone Diagram Root Cause Analysis Diagram, and when to use this (more capable) Root Cause Analysis Map - which has options to link to a detailed Problem Analysis and Timeline, as well as to associate and link problems to their related Corrective and Preventive Actions. This is something that is missing in a traditional Fishbone Diagram. December 2016. Almost as fast and easy to use as the more well-known Fishbone Diagram, this Root Cause Analysis Tool is a better choice when you want to be more thorough. In addition to the (more informative) drawing area, there are also optional areas for countermeasures, and more thorough Problem Analysis. |
 Scatter Plot November 2020. Improved help for how to (optionally) apply chart labels. And improved help for Correlation Analysis. January 2017. Scatter Plot to graphically show the relationship between two sets of data. And to determine whether the two variables might be correlated. |

SIPOC Diagram November 2020. Several useful new flowchart shapes. The SIPOC template to provide an 'at a glance' overview of a process, and identify the suppliers and inputs and customers and outputs of a process |
Project Management tools
Below is a list of the most recent improvements in some templates in Project Management Tools and Methodology.
| Project Management Tools |
|---|

Gantt Chart November 2020 - Updated Work Calendar Adjustment Factors to correctly adjust for working days and holidays, so that you can accurately answer your customer's question: “When can I have it?” October 2019 - New 'Add Rows' button — to easily add rows with the click of a button — correctly inserting new blank rows with correct formatting and formulas, and automatically unprotecting and re-protecting each workbook with correct protection settings (so that you don't accidentally damange formulas) Find out more about the Gantt chart template. |
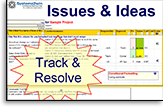 Problem Solving Tools November 2020. Issues and Ideas template - Improved format and Help - to systematically 'table and come back later' to good ideas that might have fallen through the cracks with less organized leadership November 2017. New Excel A3 template. Upgraded Word A3 template. Expanded online training for A3 Problem Solving, 8 Step Problem Solving, and other problem solving tools and methods. New training video. New Is Is Not Analysis template. |
|
Data Conversion Planning 
February 2020. This data conversion planning template empowers your teams to convert data from any software to any other software. Most commonly used for software projects for upgrading ERP, MRP, CRM, inventory, or accounting software. When used for planning automated data conversion, this serves as both 1) the plan, and 2) the intermediary document used for data cleansing, and then final import into the new application. Can be used for planning manual data conversion (hand-entered), thereby enabling your team to use this one single tool to plan and convert any data - reducing costs and mistakes. |
 Approval Form November 2017. Upgraded template and training for Problem Solving Approval Process (which has been called "the single most important part of the Toyota system") |
Lean tools
Below is a list of the most recent improvements in some templates in other Lean Tools and Methodology.
| Lean Tools |
|---|
 Kanban Calculator November 2020. Improvements to formulas to correctly calculate the number of Kanban’s needed to meet different streams of customer demand, taking into consideration demand and process variations, buffer and safety stocks, and ALL of the factors that should be considered for different types of Kanban environments. October 2016. New Kanban Calculator template to systematically avoid common mistakes when calculating the correct number of kanbans to avoid stock outs and maximize throughput. |

Standard Work November 2020. New option to supplement the standard Value Add codes with your own user-defined Value Add codes October 2019. New 'Add Rows' button — to easily add rows with the click of a button — correctly inserting new blank rows with correct formatting and formulas, and automatically unprotecting and re-protecting each workbook with correct protection settings (so that you don't accidentally damange formulas) May 2018. Finished series of 7 training videos. December 2015. Major upgrade for Standard Work template. Time Observations can now be entered directly on the form - using either video or stopwatch. New 'Frequency' codes finally solve the most vexing problem of Standard Work Analysis: "How to handle things that happen infrequently?" Now elegantly handles machines that make multiple items per run cycle. New sections for 'Run Cycle Analysis' and 'Shift Cycle Analysis'. Andons turn bold red italic if your plans won't meet your goals. September 2015. Now allows you to analyze your video time observations in your preferred Time Unit of Measure: seconds, minutes, or hours. This template also contains features to support SMED setup time reduction. |

Swim Lane Cross Functional Flowchart November 2020. Improved What If Analysis Scenario Management for this popular and powerful tool to analyze and improve ANY type of process (manufacturing or service) that gets handed off between team members and stakeholders. And Scenarios allow you to instantly switch between different 'What If' situations - without having to re-draw an almost-identical flowchart. This flowchart does what Visio can't: Math. September 2019. New button to 'Add or Remove Rows or Columns' — to easily, instantly, and flawlessly add or remove tiers of related rows for swim lanes, and/or tiers of related columns containing complex math for many types of useful analysis, including lead time, process time, value add time, capacity, smallest possible staff, and allows you to instantly switch views between different scenarios (such as normal vs. expedited). Many new features for Makigami Analysis — (a popular way to analyze workflows for non-manufacturing service and administrative processes). 3 ways to depict and analyze forms, screens, and databases that carry or store information. 3 ways to highlight problems and barriers to flow. Value Add Analysis is now more visual and allows you to specify what percent of Process Time is Value Add (as perceived by your customer). Demand per Week can now be converted into Demand per any user-defined time period, (such as month or year). August 2018. Cumlative Lead Time lets you know when each step is expected to happen. (for example day 11, day 12...) New features and training for alternative ways to handle complex sub-processes. February 2018. Easier ways to calculate and analyze Lead Time, Queue Time, and Process Lead Time. August 2016. New Lead Time Chart, and Work Load Balancing chart. Andons to highlight when your plans won't meet your goals. Greatly improved features for Paths and Scenarios, to depict multiple conditions on a single flowchart. New feature to correctly calculate Lead Time and Cycle Time for Dead End processes. Better support for international users. Mistake-proofing and more intuitive ways to hide, add, or move rows or columns. Clearer training. The Cross Functional Flowchart template can be used to clearly depict processes that cross functional workgroups. |
|
Yamazumi Chart 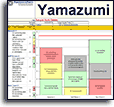
June 2020. If a short description (that appears as a chart label) has supplemental long notes, then the decscription on the chart is appended with an asterisk * to prompt you to also look at the Notes. Better systems and clearer instructions for how to multiple workers or teams who are all doing the same thing. Improved systems to allow you to define your own chart colors, and to choose whether your chart colors will be based on Value Add codes (VA), or your user-defined Category codes (Cat). New training videos. September 2016. Major upgrade. Can now handle unlimited Activities for unlimited Operators or teams. Zoom in to study selected operators. Many new ways to configure your chart the way you want it. At any time, change the details that you show on your chart for each Work Element. (Row number, Work Element description, time, and user-defined codes). Chart colors can now be based on either Value Add codes or your own user-defined Category codes. New Analysis section includes Smallest Possible Staff, and Employee Utilization. Now supports Product Mix for unlimited number of product or service deliverables. The Yamazumi Chart template can be used to rearrange tasks, eliminate waste and balance work loads. |
 Work Instructions (aka Job Instructions) April 2020. New feature to easily hide or show rows containing Tips.New visual symbols to highlight Key Points for Safety, Quality, and Tips to make work easier. Also some minor bug fixes. May 2019. When you 'Generate Report' for 'All Products or Services', you have the option to Skip Status Codes that begin with 'X-' (For example, X-Expired, or X-Obsolete). February 2019. Substantially faster processing time. Every template that copies images now has faster processing time, but the Work Instructions template is most noticeable — especially when you click the button to 'Generate Report' for 'All Products or Services'. A whole lot of copying goes on behind the scenes, as it generates a separate worksheet for each product or service in your product family — each correctly including or excluding those visual work instruction steps that are or are not relevant for each product in the family. August 2017. When you click the button to 'Open a Blank Sheet', in your Work Instructions template, you now have the choice to either:
April 2016. 'Add Image' now has choice to add normal size image or wide image. June 2015. New 'Hide / Show Rows' button allows you to maintain multiple items for a product family in a single workbook - instantly generating updates for all items with the click of a single button. New button to 'Add Rows' - including the ability to add a Header Row for a Page Break. Supports larger images, and more diverse ways to handle long work instructions. |
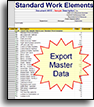 Standard Work Estimating July 2016. New features allow you to use your Standard Work template to estimate times and costs for new product development, make-to-order, and/or standard cost accounting. New Standard Work Estimating template to maintain master list of Standard Work Elements that can be exported to multiple documents created using your Standard Work template. |
DFSS Design for Six Sigma tools
| Design for Six Sigma tools |
|---|
Control Plan November 2020. FMEA Control Plan now has Action Priority codes that match the FMEA (red, yellow, green) Action Priority codes. August 2015. Control Plan can now be an optional sheet within the FMEA workbook. |
|
Process Flow Diagram November 2020. More flowchart shapes in both the Process Flow Diagram and FMEA Process Flow Diagram. August 2015. Process Flow Diagram template can now be an optional worksheet within the FMEA workbook. |
 FMEA Excel template October 2019. New button to easily 'Add Rows'. Updated Ratings tables for Action Priority codes. May 2019. Major upgrade to incorporate innovations for the new AIAG Core Tool Set format. RPN Risk Priority Number is replaced with (much more useful) Action Priority codes. 7 Steps of FMEA now super-impose standard work for FMEA teams - making it really obvious to not skip the first 2 steps that should be completed before touching the first column of the FMEA form, and not skipping the final step that starts when the last column has been completed. Much clearer inter-relationships between the Item or Process Step that is the focus of the FMEA and it's Parent and Child inter-relationships. July, 2017. Improved features for using Excel's Filter and Pivot Tables to analyze and filter your DFMEA's and PFMEA's. New features to allow you to Insert Sheets and Charts for Pareto analysis, Run charts, Histograms, etc. August 2015. FMEA template now includes Process Flow Diagram and Control Plan as optional worksheets within the same workbook with the FMEA. There is also new training for how to link cells to auto-populate data from other cells (for example to instantly change a superceded Control Method everywhere that it exists. Find out more about the FMEA template. |
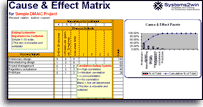
Cause and Effect Matrix October 2019. New 'Add Rows' button — to easily add rows with the click of a button — correctly inserting new blank rows with correct formatting and formulas, and automatically unprotecting and re-protecting each workbook with correct protection settings (so that you don't accidentally damange formulas) Find out more about the Cause and Effect Matrix. |
 OEE Overall Equipment Effectiveness October 2017. Can now handle processes that make multiple Batches of the same product within a single Shift. April 2016. New form for manual collection of data that later gets entered into your OEE template for analysis. Also new features to print your user-defined Category and Reason codes for Rejects and Lost Time. And other minor improvements. This template can also be used for TPM Total Productive Maintenance — to maximize the effectiveness of your bottleneck resources. And unlike any other OEE software — this comes with an entire suite of continuous improvement tools — so you can actually solve the problems that OEE analysis uncovers. |
This What's New page highlights only the most dramatic and newsworthy improvements
At Systems2win we are truly "all about continuous improvement", and every single week of the year, we release minor improvements to improve your templates, online trainings, videos, and systems for continuous process improvement.
Thank you for choosing Systems2win
to empower your leaders to continuously improve
Contents
Systems2win chosen as Most Trusted Consulting Firm
Systems2win is honored by Insights Success magazine for 10 Most Trusted Consultants of 2018
150+ Templates
Try Some
Own Them All
Download Trial Now
Get a dozen trial templates,
and another dozen free gifts
@@@ Better conversion rate
if call to action is for a specific tool, and shows the image
Try It
Try this template
along with a couple dozen more
process improvement tools
Calls to Action Botttom

Related Topics
Related Topics section WITHOUT TESTIMONIALS
Replace this paragraph with menu library item for topics related to this video
Training and Coaching
Consider Training and Coaching to support your teams to succeed
Training to get you started.
Tools you won't outgrow.
Schedule a Conference
Schedule a conference
to discuss your challenges
with an experienced lean advisor