
Process Improvement Tools.
Standard Work.
Work Instructions.
Flow Chart templates.
Swim Lane Cross Functional Flowchart.
Value Stream Mapping.
Lean tools.
Yamazumi Chart template.
Time Study templates.
DMAIC tools.
Quality Improvement tools.
House of Quality QFD.
FMEA Risk Reduction.
Root Cause Analysis tools.
Problem Solving tools.
OEE.
Preventive Maintenance.
Skip to main content


Installation and Setup
Installation - Each User. Installation - Multi-user. Language Translations. Personalize Your Templates.Systems2win Training.
Quick Start Initial Training. New User Training. Training Matrix. Systems2win Leadership. Training Classes.Lean Training
Lean Training and Coaching. Lean Principles. Muda 8 Wastes. Goal - Lean Flow. Roadmap - Lean Journey. Value Stream Mapping. Standard Work. Hansei Lean Thinking. Lean Dictionary. Online Lean Training. Lean Leadership.Microsoft Office Training
Excel Training. Excel Drawings (without Visio). Excel Charts. Word Training. PDF Training. Document Storage and Naming.Support
Support.Yamazumi Chart Template
aka yamazumi board, workload balance chart...
What is Yamazumi
A lean process improvement tool to see and eliminate waste
The Japanese word means 'to stack up'.
A Yamazumi board is a stacked bar chart
where the bars are the process time workloads assigned to each worker.
Sample Yamazumi Chart example
Download Yamazumi Chart. Fun to use. Try it for yourself
Why and when to use a
Yamazumi Board
The purposes of this popular lean tool are...
- to visually depict the sub-tasks of a process
- how tasks are divided between workers
- which tasks are value add, obvious waste, or somewhere in between
- to easily rearrange tasks
- to make waste visually obvious
(so the 8 muda wastes can be reduced or eliminated)
- to improve lean flow
- to balance work loads between workers or teams
- for SMED quick change over setup reduction
All lean objectives
reduce or eliminate
the 7 types of waste
How to use your
Yamazumi Chart Excel template
Before getting started
Your leaders might have already personalized your master template
in ways that your personalizations will be automatically found and transferred every time that you upgrade.
Find and open your template
Find and open your Yamazumi template
(Yamazumi.xlsx)
in the same way that you find and open your other 150+ Systems2win templates.
If you don't yet own a license, you can download your free trial now.
Save your working document
following the usual document storage and naming conventions established by your leaders
Open a Blank Sheet
When you're ready to start doing your own real work...
click the button to 'Open a Blank Sheet'
Excel Ribbon > Systems2win tab > Open a Blank Sheet
This blank sheet is where you will do your real work
(not on the Sample sheet — which gives you sample data that is extremely helpful for learning how to use your new tool, but is the wrong place to do your real work)
Rename your new sheet.
Or... Insert Sheet
As an alternative to opening a stand-alone document (as instructed above),
you also have the option to Insert Sheet into any other Excel workbook
that was created from a Systems2win template.
If English is not your preferred language
Switch to your language, just like every Systems2win Excel template.
First Pass: Enter your data
Step 1) Complete the header fields
at the top of the page — above the gold row headers
Like every other Systems2win template, click any row or column header for pop-up help.
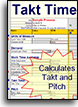
Takt Time
The desired average time between completed units 'coming out the end of the pipe'.
The value that you enter here will appear as the red line on the chart.
See Lean Glossary
Perhaps use your Takt Time Calculator template
Perhaps use the button to Insert Sheet — to insert a Takt Time Calculator sheet into your yamazumi workbook.
Unit of Measure (Time)
Use one consistent unit of measure for all times on the entire sheet. (Usually seconds)
User-defined headings
Like every Systems2win Excel template, your leaders can personalize your master template
in ways where your personalizations will be automatically found and transferred to your new upgraded master template every time that you upgrade — so that over the years... your templates become more and more... yours.
Step 2) Enter your data
Who
Enter the Job Title (or a simple number)
for each operator, staff person, or team.
Tips:
There should only be 1 entry in the 'Who' column for each operator or team.
There should not be any other data in the same row with the top-level title for operator or team.
There should not be any data in the 'Who' column for any row that has a Work Element.
It is okay to have blank rows above each Operator title.
It is not okay to have blank rows within the block of Work Elements for each operator or team.
Work Element
Enter a very BRIEF description for each Work Element
Ideally 2-5 words, usually starting with a verb.
Tip: To mimimze scrolling, word wrap is usually off in the Work Element column. You can always quickly resize that column to show or hide long text.
Because the primary value of a Yamazumi Board is to rearrange tasks...
it is really important for every team member to fully digest
the definition of Work Element
Each Work Element starts and ends with a break point
where work COULD be handed off from one worker to another
(so that Work Elements can be rearranged if or when needed)
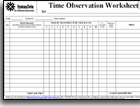
This precise and correct definition of a Work Element is extremely important when using your Time and Process Observation Forms.
If your time observer didn't truly understand this definition, then you need to start over, and re-observe the process.
Time
Enter the Process Time Per Unit for each Work Element.
All times must use the 'Time Unit of Measure' that you defined in the header fields.
This is 'Process Time per Unit'
If something happens every Run Cycle,
then there is no difference between 'Process Time' and 'Process Time per Unit'.
If something happens on any other Frequency cycle,
then you need to enter the 'Process Time per Unit'.
For example, if 'Process Time' for the Work Element 'Shift Setup' = 1000 seconds, and the Batch Size for your Run Cycle is 1000 units, then 'Process Time per Unit' = 1 second.
Yamazumi Analysis usually focuses (almost exclusively) on the Run Cycle.
It is common to simply ignore Work Elements that happen less frequently than the Run Cycle, or to simply subtract a rough guesstimate from Work Time Available when calculating Takt Time.
For more thorough analysis, your Standard Work template has extremely powerful features to analyze work that happens on any Frequency cycle (not just 'Run Cycle').
If a Work Element has no Time, it will not be charted.
If a Work Element has a Time of zero or 'x', it will be charted.
In these ways, you can choose how you might want to highlight steps that your team has eliminated through your hansei efforts between your 'Before' and 'After' conditions.
If your process produces a mix of products (or service deliverables)...
then see the advanced training for the optional columns for Product Mix.
Value Add?
In the VA column, use the dropdown list to define whether the Work Element activity is:
▲ Value Add (green)
∆ Non Value Add, but necessary (yellow)
□ Walk (or any type of transport performed by the operator) (yellow)
■ Wait (red)
▼ Waste (red)
Optional columns outside of the Print Area
If you are not using any (or all) of these optional columns
then Hide them. (Don't delete)
You can use everything you know about familiar Microsoft Excel
to set the Print Area to include columns that are usually outside of the Print Area.
Links to related documents
Like all Systems2win templates,
you can optionally use Link Icons to link to related documents or training.
Notes *
Work Element descriptions should be very BRIEF, (ideally 2-5 words), perhaps supplemented with additional Notes in this column.
Notice that the Work Element description in the chart label will be appended with an asterisk * to prompt you to look at the Notes that supplement the (brief) chart label. (this requires a Yamazumi template v16.1 r200609 or later)
Tip: If you toggle word wrap off, you can always temporarily widen the column to read long Notes. (making more efficient use of space)
Tip: You can easily move the Notes column, and you can easily include that column in the Print Area.
Category
You can optionally use the Category field for any user-defined purpose.
Like all Systems2win templates, all dropdown lists are defined on the DV sheet.
Tip: Your Category codes can be numbers or characters, but you might want to to use symbols, because:
- In your chart labels, symbols make a better visual separator between the Work Element Description and Time.
- If you have international team members, symbols communicate the same information in any language.
- Symbols are simply more visual. And one Lean Principle is to communicate as visually as possible.
And like all Systems2win templates, your leaders can optionally personalize your master template in a way that your own dropdown list of Category codes will be automatically found and transferred to your new master template each time that you upgrade in the future... so that your templates become more and more... yours.
If you want your chart colors to reflect your Category codes
(rather than the default chart colors for Value Add codes)
then see the advanced training for the Color Chart.
Product Mix
If your process produces just one product (or service deliverable)...
then Hide (don't delete) the two columns for Product Mix.
If your process produces a mix of products (or service deliverables)...
then see the advanced training for Product Mix.
How to Add and Move Rows
You can add as many rows as you need above the bottom thin gold line.
Don't just 'Insert Rows'
To Copy rows, use use Insert Copied Cells
To Add rows, use 'Insert Copied Cells' to copy a blank row
To Move rows, use 'Insert Cut Cells' (see training video)
If you haven't already...
watch this training video to learn these foundational Excel skills
Excel training video
Add, Copy, or Move rows
Tip: If you leave blank rows above each operator or team,
then you always have blank rows nearby to copy, and they serve as a pleasing visual separator between operators or teams.
There can be blank rows between operators/teams, but there cannot be blank rows within each block of Work Elements for each operator or team.
See more tips to add, copy, move, or eliminate rows for Work Elements - in the training section on this page for Workload Balancing
Step 3) Click the button to 'Update Chart'
In the Systems2win menu in the Excel Ribbon bar, select 'Update Chart'.
A whole lot of fancy programming will automatically refresh the chart each time that you click this button.
Whenever you make any changes to your data, click this button again — to refresh your Yamazumi Chart.
Now that you have data... use your
Yamazumi template
Save and Copy your Current State
Before you start rearranging and improving...
Save your Current State sheet
so that you can compare your Current conditions to your Improved proposals
Copy your Current State sheet
to serve as the starting point for your Future State
Use the special button to 'Copy Sheet'
Excel Ribbon bar > Systems2win tab > Copy Sheet
A Yamazumi Board is not Art
Now if all you wanted was a pretty chart to hang on your office wall...
you could just Print,
and you would be done.
But a Workload Balance Chart is not intended to be framed and mounted on a wall as a conversation piece.
Many Yamazumi tools are not functional
A quick search of the Internet will surface several eye-catching tools that are simply not functional.
If a Yamazumi tool does not allow team members to easily rearrange tasks, then it is not functionally fit to perform the intended purposes:
- to eliminate waste
- to improve process flow
- to balance work loads between operators and teams
Your Systems2win Yamazumi template is fully functional — to Define, Measure, Analyze, Improve, and Control your processes — not just "draw a chart".
Now it's time to USE your Yamazumi Excel template !!!
to think, ponder, reflect, and actually IMPROVE the process
Improve your process
Eliminate Waste
As the leader or facilitator of your team, now is the time to
Stimulate your people to think
(not just blindly go along with whatever someone suggests)
Tip: If you haven't yet bookmarked the Hansei page...
(to come back to again and again on your lean journey...)
then bookmark that page now
Value Add Analysis
For each red or yellow Work Element...
how might this work be minimized or eliminated?
Workload Balancing
No stacked bar can be taller than the red line for Takt Time
Or otherwise you won't meet your production schedule.
How to quickly go to the row for editing
In the 'Configure Chart' section,
use the dropdown list to select 'Row = TRUE'
then in the Systems2win menu, select 'Update Chart'
Learn more about how to Configure Chart
The chart labels for every Work Element will now start with the Row number
thereby making it very easy for you to quickly find the row to edit.
Tip: To quickly Go to cell
Type 'CTRL+G', then enter the cell number.
For example if you want to go to row 25, enter any column letter followed by that row number.
For example: H25 brings you immediately to the cell to edit the Description for that row.
How to move Work Elements
When the process was observed,
if your observers were skillfully taught and coached to clearly understand the definition of a Work Element, then any Work Element will now be easily rearranged by simply moving the row.
If your process observers were not skillfully taught and coached the first time, then you will now need to re-observe the process, with more attentive leadership this time.
If you didn't skip the New User Training,
then you already learned the elegant ways for how to move rows in Excel.
Remember... this training was emphasized as "the single most important Excel skill that you will ever learn"
How to add a row for a new Work Element
The same training video for how to move rows also teaches the elegant ways for how to add rows.
Reminder... Do not not use 'Insert Rows'.
Instead, you need to copy a similar blank row... so that your new row has the needed formulas.
Tip: If you leave blank rows above each Operator,
then you always have blank rows nearby to copy, and they serve as a pleasing visual separator between Operators.
There can be blank rows between Operators, but there cannot be blank rows between Work Elements for each Operator.
How to eliminate tasks
To permanently delete it, simply delete the row.
Select the entire row, then right-click > Delete
or keyboard shortcut ALT + E + D
If you eliminate a task, and still want to show the eliminated task, you have 2 choices:
- Time = 0 (or x) — will show on the chart
- Time = blank — won't
Avoid this common mistake when Work Load Balancing
If you have substantial extra time available...
for example, you need 2.3 workers, or maybe 2.1 workers,
then the novice lean practitioner
will attempt to spread the work evenly between all 3 workers.
While that approach might sometimes make sense,
the experienced lean sensei
will often (perhaps usually) attempt to free up as much time as possible for 1 of the 3 workers.
Why?
(We're not going to give you the answer. Think about it.)
Avoid this even bigger mistake when Work Load Balancing
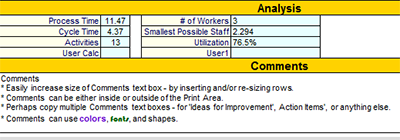
By popular request, we added the 2 fields in the bottom Analysis section for:
- Smallest Possible Staff
Process Time / Takt Time
- Employee Utilization
Process Time /
(Takt Time * # Workers)
These are dangerously misleading numbers.
The truth is that Yamazumi analysis does not take into consideration all of the factors needed for accurate answers to those 2 measures.
At best these are extremely rough estimates that are ALWAYS UNDERSTATED with the incomplete information available for Yamazumi analysis.
If your management wants accurate answers to those questions,
then use your Standard Work Analysis template (StdWork.xlsx)
which allows you to do a very thorough analysis of other relevant factors, like shift setups and breakdowns, batch change-overs, batch quantities, quantities produced per run cycle (think of a machine stamping out a dozen at a time), things like inspections, palletizing, and other things that happen on a frequency cycle other than the run cycle, and those "just a few minutes of your time" meetings called by the same managers that are now raising their eyebrows at the big gap between your actual staffing level and the 'Smallest Possible Staff' number at the bottom of your Yamazumi Board.
And every single time that you lead any process improvement team, it is essential to remind people of
your management's commitment to your organization's Job Security Promise
(that is written and published in many places throughout your facilities)
No one will ever lose their job as the direct result of any process improvement activity
Improve Flow
The most common gain that you will get from using the Yamazumi process
is to reduce and eliminate waste
The most skillful facilitators will get even bigger gains
by encouraging and empowering team members to
identify and eliminate barriers to flow
Learn more about barriers to flow
and Hansei methods to stimulate Lean Thinking
Why is flow so important?
Although your Yamazumi Diagram is quite useful for creating lean flow...
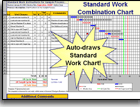
the Standard Work Combination Sheet is even better.
The Standard Work Combination Chart provides similar information, and also provides visibility and control of additional details for each Work Element that often make it an even more useful tool for taking a process apart and putting it back together more intelligently.
More Yamazumi Analysis
In addition to the usual (pre-defined) columns, you can easily add your own columns for things like:
Process Time
Process Time = the sum of all Process Times for all Operators.
And remember, this is 'Process Time per Unit'... as explained earlier.
Cycle Time
Cycle Time = the Process Time for the Operator that works the longest.
And remember, that an 'Operator' might actually be a team.
Activities
This is a count of the total number of Work Elements for all Operators.
User-defined Calculations
It's Excel. Use everything you know about familiar Microsoft Excel to calculate anything else that is important for your yamazumi analysis.
or we could use a shared
Lean Glossary...
Use Comments wisely
At the bottom of your Yamazumi template, you will find a Comments text box.
Here are some Tips for how to use your Comments wisely:
- Perhaps copy multiple Comments text boxes — for 'Ideas for Improvement', 'Action Items', or anything else
- Each Comments text box can be either inside or outside of the Print Area.
- Easily increase the size of any Comments text box — by inserting and/or re-sizing rows.
- Comments can use colors, fonts, and shapes.
Train your people
Just because your team came up with a (theoretically) better way of doing it,
doesn't mean that the people doing the work will actually do it your new way.
Your Systems2win templates come with a variety of tools to make your training easier and more effective.
Why re-invent?


Choose the right Training Tools
Own your
Yamazumi Board template
with many other useful Lean Tools
for continuous process improvement
to empower every team member to improve every process
Advanced Training for your
Yamazumi Chart template
Product Mix
If your process produces a mix of products (or service deliverables)...
then unhide the 2 columns for 'Product Mix'
Define your Product Mix
In the Mix header cell, click the 'anchor' link,
which will take you to the Product Mix Table
(far below the primary data entry area)
Remember... whenever you see an 'anchor' link in any Systems2win document,
that means that you can click it to quickly go to another place within that same document.
In the Product Mix Table, define your mix.
Code
Enter a BRIEF code for each type of product or service.
Ideally, Mix codes should be 3 characters or less.
Yes, your yamazumi template supports unlimited products or services in your mix.
You can add unlimited rows in this table. Just insert your new rows above the thin gold line that defines the bottom of the table.
Percent
For each code, enter the percent of demand.
Notice that there is an error check field at the bottom of the table that turns purple and says "Err" if the sum of your percentages does not equal 100%.
You can hide this row if you have a legitimate reason for a product mix that doesn't total 100%,
but most users will usually find this error check helpful.
Copy the blue cell
Just below the Product Mix table,
there is a blue cell containing a (rather complex) formula.
Copy that blue cell
and paste it into the 'Time' column in the primary data entry area for any row that needs to be calculated for Product Mix.
Paste it into the 'Time' column in the primary data entry area,
NOT the 'Time' column for 'Product Mix' - which is outside of the Print Area.
Reminder: Whenever you need to quickly copy that blue cell for another Work Element,
you can quickly click that 'anchor' link in the header cell for the Mix column — to quickly go to the section where you can quickly copy the blue cell
and then use 'CTRL+Home' to quickly return to the upper left corner of your worksheet.
And if you turn on Freeze Panes, then your headers are always at the top of your page even as you scroll.
Enter Product Mix Data
Mix
In the 'Mix' column, use the dropdown list to choose the type of product or service.
Time
In the 'Product Mix — Time' column, enter the Process Time per Unit.
Assuming that you correctly copied the blue cell containing the Product Mix formula...
Notice that the 'Time' column in that blue cell in the primary data entry area now correctly calculates the Process Time per Unit as
Process Time per Unit (in the Product Mix 'Time' column) * % of Demand
If you import from your Standard Work template
(rather than entering data directly — as decribed above)
You can (optionally) do even more powerful process analysis using your Standard Work template.
If you follow the instructions in this training video to export data from your Standard Work template to your Yamazumi template,
then you might have already used Frequency codes to analyze your product mix.
If so, then in addition to copying over the rows with a Frequency of 'Run Cycle', you can also copy those rows that have a Frequency code for product mix
And for those rows, copy the Frequency code from your Standard Work template to the Mix column of your Yamazumi,
but do not enter anything in the Yamazumi Mix Time column
(because your Product Mix ratios have already been calculated in the Standard Work document that you are copying from)
Video: Work Load Balancing
and Value Add Analysis
If you use your Standard Work template to thoroughly analyze your process, then you will also have accurate answers to vexing questions that Yamazumi Analysis is too simplistic to answer — Questions like:
How much time per unit is required for setups and change overs?
How much time per unit should we allocate for inspections, paperwork, and other things that happen on a frequency cycle other than 'every unit'?
Can we analyze more details?
Yes, you could even export every line item...
(not just the line items with a Frequency cycle of Run, or a Product Mix)
And then you would have some Work Elements with extremely tiny 'Process Time per Unit', because that step might only get performed once every batch or shift (which might make 2000 units).
As a rule, however, Yamazumi analsyis should focus solely on the Run cycle...
and you can bring out your (more powerful) Standard Work template if and when you find it useful to perform both Run Cycle Analysis and Shift or Batch Cycle Analysis
to answer questions like 'how much does it cost?' and 'how many can we make?'
and other questions that a yamazumi chart was not designed to answer.
And remember, your Standard Work template already has the Standard Work Combination Chart
which is essentially a horizontal Yamazumi chart with less detail per operator.
So if you already took the time to do a (more indepth) standard work analysis, then many advanced lean practitioners will find their Standard Work Combination Chart to be very sufficient for their Run Cycle Analysis needs, without any need to export to a Yamazumi chart at all.
When you own your Systems2win tools, you have the right tools for both:
- Fast, quick and dirty analysis (like a yamazumi)
- In depth deep-dive analysis (to answer tougher questions)
How to configure your
Yamazumi Chart Excel template
If your process has fewer than 254 Activities, then
your Yamazumi template will work just fine if you simply use the default settings.
You can, however, optionally configure your Yamazumi Chart in several powerful ways.
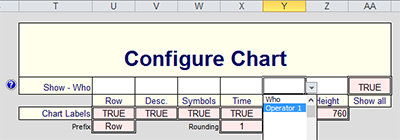
Scroll to the right of the primary data entry area to find the section to 'Configure Chart'
Show - Who
There are six white fields where you can use the dropdown lists
to choose which operators or teams you want to highlight in your chart.
If your process has fewer than 254 Activities, then this is entirely optional.
If you simply leave all 6 of these fields blank, your Yamazumi will show full details for every Activity for every operator or team.
If your process has more than 254 Activities, then this is not optional.
You need to choose which operators or teams to show details.
Show All
If 'Show All' = TRUE,
then your Yamazumi chart will show a column for every operator
with details for the operators that you selected in the 'Show Who' cells
and a single bar (showing only the total) for each of the other operators.
If 'Show All' = FALSE,
then your Yamazumi chart will show (detailed) columns for only those operators that you selected in the 'Show Who' cells
In this way, you have the ability to 'zoom in' on selected operators
Chart Height
If you leave this field blank, then your chart will automatically resize to fit the space available.
If you have a lot of rows, and you want your chart to fit on only the first page...
then enter a number in the Height field, and click the 'Update Chart' button again.
Repeat until your chart is your desired height.
Chart Labels
At any time, you can change the details that get displayed
in the Chart Labels for each Work Element in your stacked bar chart.
At any time, you can change the details show in the Chart Labels
for every Work Element in your Yamazumi Chart
There are 4 pink cells where you can use the dropdown lists to choose TRUE or FALSE
to include or exclude the following 4 elements:
Row Number
If TRUE, then each chart label will start with the Row number
to make it easy to quickly find (and perhaps edit) your Work Elements.
And you can optionally precede your row numbers with a prefix,
such as 'row', or 'r', or any other useful prefix in your chosen language.
Work Element Description
You will usually want to show the Work Element Description,
but it is sometimes helpful to be able to temporarily show only row numbers
especially for extremely large charts, or situations where you imported your data from some source that did not appreciate the value of keeping descriptions BRIEF. (ideally 2-5 words)
If a Work Element has a Product Mix code, then the Description will also be preceded by the Mix code
which should also be BRIEF. (ideally 3 characters or less)
Symbols
If TRUE, then your chart labels will include the symbols (or codes) that determine the colors used in your chart.
Many users will find this helpful for several reasons:
- The codes make a nice separator between the Description and the Time
Especially if your codes are symbols, rather than numbers or characters
- The codes reinforce the colors
and make a clearer imprint on the subconscious mind
- It is a requirement of the Americans with Disabilities Act (ADA)
which is required of all software used by any United State federal government agency, or any company that might some day hope to serve as a contractor to the U.S. federal government. Learn more about how your Systems2win software can be used by blind people with no hands.
Time
If TRUE, then your chart labels will end with the 'Process Time per Unit' for each Work Element.
And you can also specify your desired Rounding
(the number of digits to the right of the decimal place)
for both: 1) the Times that appear for each Work Element,
and 2) the Times that appear in the X-axis chart labels (showing total time for each Operator)
Make your templates yours
And yes, of course, just like every Systems2win Excel template...
the choices that your leaders make to personalize your master templates
can be automatically found and transferred to your new master templates
each time that you upgrade in the future
so that over the years,
your templates become more and more...
yours
Your personalizations
get found and transferred
each time you upgrade
How to switch between colors in your
Yamazumi Chart template
By default, the colors on your Yamazumi Chart will match the colors for your Value Add codes.
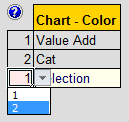
Or you might use the (optional) dropdown list in the pink double-bordered field
to choose to use your user-defined Category codes — to determine the colors for your stacked bar chart Work Elements.
This only works if you optionally defined Category codes on the DV sheet
and if you personalized the Color Table to assign colors to each of your user-defined Category codes, following the instructions below.
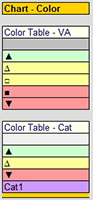
How to personalize colors in your
Yamazumi Chart template
Your leaders can scroll down (far) below the primary data entry area
to find an area that allows them to personalize your chart colors.
Use Color Table - VA
to personalize colors for your (perhaps personalized) Value Add codes.
You might want to think twice about that, however, because these colors were scientifically chosen to comply with U.S. government requirements for readability by color blind and disabled people.
Use Color Table - Cat
to personalize colors for each of your user-defined Category codes
that you defined on the DV sheet
Tips:
You can add unlimited rows within the upper and lower gold-colored boundaries of each color table.
If your organization owns the Sync feature, then the dropdown lists of codes that you define on the DV sheet will be automatically found and transferred to your new master template each time that you upgrade,
but the color tables won't... so be sure to make a note in your Customization Log as a reminder to manually copy & paste your personalized color tables to your new master template each time that you upgrade.
Return to the home page for Standard Work
Contents
New User Training
Your Systems2win templates come with free New User Training
to quickly learn features that are common to all 150+ templates

Questions?
One huge benefit of owning your Systems2win templates is Support when you need it

Own Yours Now
Own your own professional tools
that you can take with you for the rest of your career
Training and Coaching
Consider Training and Coaching to support your teams to succeed
Training to get you started.
Tools you won't outgrow.
Schedule a Conference
Schedule a conference
to discuss your challenges
with an experienced lean advisor
150+ Templates
Try Some
Own Them All
Download Trial Now
Get a dozen trial templates,
and another dozen free gifts
@@@ Better conversion rate
if call to action is for a specific tool, and shows the image
Try It
Try this template
along with a couple dozen more
process improvement tools
Calls to Action Botttom

Related Topics
Related Topics section WITHOUT TESTIMONIALS
Replace this paragraph with menu library item for topics related to this video
Training and Coaching
Consider Training and Coaching to support your teams to succeed
Training to get you started.
Tools you won't outgrow.
Schedule a Conference
Schedule a conference
to discuss your challenges
with an experienced lean advisor