
Process Improvement Tools.
Standard Work.
Work Instructions.
Flow Chart templates.
Swim Lane Cross Functional Flowchart.
Value Stream Mapping.
Lean tools.
Yamazumi Chart template.
Time Study templates.
DMAIC tools.
Quality Improvement tools.
House of Quality QFD.
FMEA Risk Reduction.
Root Cause Analysis tools.
Problem Solving tools.
OEE.
Preventive Maintenance.
Skip to main content


Variations


Installation and Setup
Installation - Each User. Installation - Multi-user. Language Translations. Personalize Your Templates.Systems2win Training.
Quick Start Initial Training. New User Training. Training Matrix. Systems2win Leadership. Training Classes.Lean Training
Lean Training and Coaching. Lean Principles. Muda 8 Wastes. Goal - Lean Flow. Roadmap - Lean Journey. Value Stream Mapping. Standard Work. Hansei Lean Thinking. Lean Dictionary. Online Lean Training. Lean Leadership.Microsoft Office Training
Excel Training. Excel Drawings (without Visio). Excel Charts. Word Training. PDF Training. Document Storage and Naming.Support
Support.Excel Flow Chart templates
Choose the right flowchart template
to graphically depict process flow
Comparison of Flowchart Templates
When to use a flowchart template vs. other Lean tools
Excel Flowchart Template
A simple flow chart (without swim lanes) is probably the most familiar of process mapping tools to graphically illustrate 'who does what', and what decisions need to be made along the way.
And we all know how many words one picture is worth.
Swim Lane Cross Functional Flow Chart
Your swim lane diagram template is ideal for designing and documenting processes with medium-length cycle times.
(For example a sales order process, engineering changes, or any process that takes days or weeks rather than minutes)
Download free trial cross functional flowchart
Value Stream Map
Your Value Stream Mapping template is a strategic tool that uses special symbols and Lean metrics to depict the flow of a product or service through an entire stream of value-adding processes — each of which might drill down to further details illustrated using one or all of the following tactical tools.
Download free trial value stream map
Block Diagram
Use your Block Diagram to create a visual, high-level sketch of a process
showing only Major Steps, sequence, operators, inventory, cycle time, and perhaps just a little more optional information.
Spaghetti Diagram
also known as Standard Work Chart or Layout Diagram
A Spaghetti Diagram is a process mapping template that shows a floor plan of your work area, and graphically shows the walk paths of each worker, and which operations are done where, and how much of the thing being transformed is stored where.
Download free trial spaghetti diagram (within Standard Work template)
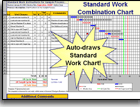
Standard Work Combination Sheet
The Standard Work Sheet is the ideal tool for designing and documenting Lean processes with short cycle times.
(For example a manufacturing process that takes five minutes, or a loan approval process that takes 2 hours)
Download free trial Standard Work
SIPOC Diagram
The center of a SIPOC diagram includes a very simple process flowchart — with columns for Suppliers, Inputs, Processes, Outputs, and Customers.
Use this tool to identify and eliminate wastes of any type: hazardous wastes and emissions, energy, scrap, packaging...
Download free trial SIPOC template
Process Flow Diagram
Prior to creating a PFMEA — use the Process Flow Diagram to identify Sources of Variation, and desired Deliverables (ideal Functions) for each Process Step.
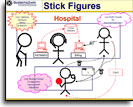
Stick Figure Illustrator
The Stick Figures Illustrator template uses stick figures to illustrate PowerPoints or A3 Reports for Lean Office and Lean Healthcare processes in ways that are more intuitive than traditional flow charts or other lean tools.
Own them all
Own all of these flowchart templates,
and many more tools for continuous process improvement.
How to use your
Excel Flowchart template
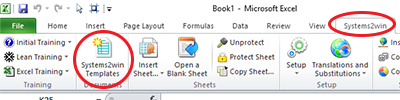
Find and open your template
Find and open your Flowchart template (Flowchart.xlsx)
in the same way that you find and open your other 150+ Systems2win templates.
Save your working document
following the usual document storage and naming conventions established by your leaders
Open a Blank Sheet
When you're ready to start doing your own real work...
click the button to 'Open a Blank Sheet'
Excel Ribbon bar > Systems2win tab > Open a Blank Sheet
This blank sheet is where you will do your real work
(not on the Sample sheet — which gives you sample data that is extremely helpful for learning how to use your new tool, but is the wrong place to do your real work)
Rename your new sheet.
Or... Insert Sheet
As an alternative to opening a stand-alone document (as instructed above),
you also have the option to Insert Sheet into any other Excel workbook.
If English is not your preferred language
Switch to your language, just like every Systems2win Excel template.
Now your team is ready to get started using your
Flow chart template
Create your 'As Is' Flow Chart
Watch these training videos
to learn how to draw using Excel as a drawing tool
without the cost and learning curve of Visio
Videos: How to use Excel
as a drawing tool
Tip: Insert all of your 'Snap To Grid' shapes first.
Then turn off Snap To Grid to add arrows and other shapes.
Analyze your 'As Is' process
Get consensus that your 'As Is' process accurately represents the way things really are now.
Copy Sheet
Use the special Systems2win Copy Sheet utility
to copy your 'As Is' sheet to serve as the starting point for your 'To Be' version.
Improve the process
The single most important part of any improvement process
is to pause to think, ponder, and reflect
on how to improve the process.
Use Hansei to stimulate Lean Thinking.
Variations
of the simple flow chart template
The modest simple flowchart serves as the Swiss Army Knife of any lean toolkit, being ideally suited for:
- Getting ideas drawn fast. (The Stick Figure Illustrator is good for this too)
- Any process that does not cross departmental boundaries
The simple flow chart template can be used to create many popular variations, including:
Macro Flowchart
aka high-level process map
Only 3-8 major steps of the process.
Process boxes are usually labeled with just a noun (such as "Order Entry", or "Credit Check"),
unlike more detailed flowcharts, where labels usually consist of a combination verb and noun (such as "Enter Data")
Top-Down Flowchart
Top row of process boxes consists of only major steps
Similar to macro flowchart,
but usually with verb/noun labels...
Beneath each process box for each major step, there is one more box itemizing a short list of the most important sub-steps for each major step.
Top-down flow chart
Detailed Flowchart
aka process map or micro map
Shows major and minor steps, delays, decision branches, loops, inputs, outputs, documents, termination points, interfaces to other processes, and any other details to clearly depict how a process is done.
Decision Tree Flowchart
aka Decision Process Flowchart, Logic Diagram, Logic Flowchart
A sequenced set of alternate paths that lead to a correct decision for what to do in different circumstances.
To create your Logic Flowchart — an expert of group of experts does the following:
- Come up with a Title to succinctly describe the situation where this decision guide should be used.
- Perhaps starting with cards or sticky notes until your Logic Diagram starts to take clearer shape — brainstorm questions that must be answered to reach the correct decision, and arrange the cards in branches for each possible answer.
- Rearrange your cards into a logical sequence.
- Review and test your Decision Process Flow chart for different scenarios and situations — modifying as you go — and transferring your sloppy note cards into a clean flowchart template.
- Give your Decision Tree Flow chart to people without expertise, and ask them to use it to make decisions. Improve your masterpiece based on their experience.
- Release your finished tool — and set up a system for feedback and continuous improvement,
and possibly a system for non-experts to get quick answers from experts for anything they find confusing.
Some simple Decision Trees might also be created using the Tree Diagram template.
Mix Logic Flowchart
The Mix Logic Flowchart is a specific type of Decision Tree
for Mixed Model Value Stream Maps with high variability of demand and mix —
to guide your Scheduler with yes or no logic paths for what to do in any circumstance.
Cycle Time Chart
A graph whose primary purpose is to visually depict how much time is spent at each step of the process.
Might also optionally show costs, and/or differentiate value add time from non-value add time.
Tip: If you use the Cross Functional Flowchart (rather than the simple one), then all of these can be automatically calculated, even if you use a only single swim lane.
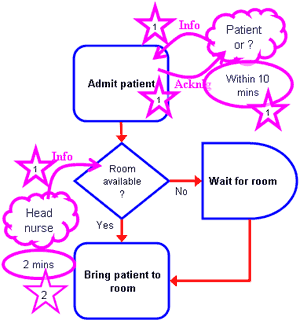
Critical To Quality Analysis
Use critical-to-quality CTQ analysis to examine a detailed flowchart to identify quality issues most important to the internal and external customer.
After flowcharting a process...
- Add shapes to the output side
in unused space around the already-drawn flowchart
Tip: You can use any custom shapes that your team desires. Popular shapes are suggested. Usually all of these related shapes are formatted the same color and line thickness — to differentiate these shapes from the regular flowchart shapes.
- Who receives each output? (cloud shape)
- Where (on the flowchart) is it received or used? (fat arrow) (how to draw a curved arrow)
- What is the output? (words on the arrow)
Outputs might be product, service, approval, information, paperwork, acknowledgement... - When is it needed? (oval)
(time or frequency) - How critical to customer satisfaction?
Rate the criticality of each "what"and each "when".
(use a star or burst, perhaps with a legend to clarify your rating scale of criticality)
- Add shapes to the input side
- Who provides each input?
- Where (on the flowchart) is it received? Used?
- What is input?
- When is it received? (time or frequency)
- How critical is it? How critical is timing?
- Create a Critical To Quality Analysis Matrix (using a matrix template)
- For each output — list your customer's needs (e.g. on time? complete? accurate?)
and assess whether each need is met. - For each input — list your own needs (as the internal customer)
and assess whether each need is met.
Your custom matrix consists of 3 columns:
- Input or Output
(which can be words for each "what", or numbers correlated to each "what"on the chart) - Customer Needs
- Met? (yes or no)
- For each output — list your customer's needs (e.g. on time? complete? accurate?)
- On the flowchart, highlight (using colors or symbols) those steps that are critical to quality
then study those critical-to-quality steps —
looking for problems or ideas to improve your process. - Optionally also create & analyze a Critical To Quality Tree Diagram.
Cost of Quality Analysis
Cost of Poor Quality template
Use Cost of Poor Quality Analysis to identify opportunities to improve quality, and reduce the costs of doing it.
After flowcharting a process...
- Draw a red circle around all steps that incur costs of quality:
to inspect, control, or fix damage.
Tip: Copy the green circle shape from Systems2win menu > Copy Shapes, and then right-click Format Shape to change the Line color.
- If few or no steps have red circles, ask,
"What can go wrong? How would we know?
How would we deal with it?"Then add steps to show how problems are handled.
- For each red circle, ask,
"What process step, if done perfectly, would allow us to uncircle or eliminate this red-circled step?"
Draw a green circle around those steps.
- Optionally calculate approximate costs of red-circled tasks,
as one factor to consider to prioritize.But don't spend too much time calculating cost of quality, keeping in mind the words of Dr. Edward Deming:
"The true cost of poor quality is unknown and unknowable."
- Analyze and improve the opportunities identified in the green–circled steps,
and the root causes in the red-circled steps.

Structure Tree Diagram
aka Gozinto Chart, or a Visual Bill of Materials
A visual Bill of Materials to visually illustrate the relationship between an item and it's lower-level sub-assemblies, parts, and materials, as well as (optionally) the higher-level item or assembly that this item is a part of.
A Structure Tree is an essential supplement to both a DFMEA and a PFMEA. You will usually use the Insert Sheet button to insert a Flow Chart sheet to illustrate a visual Bill of Materials as a sheet within your FMEA template.
Boundary Diagram
The Boundary Diagram is a graphical illustration of the relationships between the subsystems, assemblies, subassemblies, and components within the object as well as the interfaces with the neighboring systems and environments.
It is often a mandatory component when creating a Design FMEA
Flowcharting Tools
Features & Benefits
Ease of use
Everything you know about Excel — you can use in these flow chart templates
Everything you learn about these templates — you can use in any other Excel worksheet
Lean-specific tools
Systems2win offers ALL of the types of flowcharting tools described above, so that you have the right tool for every process and phase of continuous improvement
Pre-programmed Lean metrics
After the pretty pictures have been drawn, how do you answer your boss's 'show-me-the-money questions' to get approval for your suggested improvement ideas?
Online help
a) Pop-up help for every row &column heading
b) Sample with learning exercises
c) Free Excel online training

Online education
On-line education to ensure that your people understand the foundational teachings of Lean & Kaizen
1 year free Technical support
So your people have the support they need — so they can focus on solving your problems
rather than troubleshooting their home-grown spreadsheets
Affordable
To empower every one of your team members with all the tools they need to improve their own work
Own all of these flowchart templates to empower every team member
Contents

New User Training
Your Systems2win templates come with free New User Training
to quickly learn features that are common to all 150+ templates
Training to get you started.
Tools you won't outgrow.
Own Yours Now
If your organization has
not yet provided a license,
own yours now
Training and Coaching
Consider Training and Coaching to support your teams to succeed
Training to get you started.
Tools you won't outgrow.
Schedule a Conference
Schedule a conference
to discuss your challenges
with an experienced lean advisor
150+ Templates
Try Some
Own Them All
Download Trial Now
Get a dozen trial templates,
and another dozen free gifts
@@@ Better conversion rate
if call to action is for a specific tool, and shows the image
Try It
Try this template
along with a couple dozen more
process improvement tools
Calls to Action Botttom

Related Topics
Related Topics section WITHOUT TESTIMONIALS
Replace this paragraph with menu library item for topics related to this video
Training and Coaching
Consider Training and Coaching to support your teams to succeed
Training to get you started.
Tools you won't outgrow.
Schedule a Conference
Schedule a conference
to discuss your challenges
with an experienced lean advisor