
Process Improvement Tools.
Standard Work.
Work Instructions.
Flow Chart templates.
Swim Lane Cross Functional Flowchart.
Value Stream Mapping.
Lean tools.
Yamazumi Chart template.
Time Study templates.
DMAIC tools.
Quality Improvement tools.
House of Quality QFD.
FMEA Risk Reduction.
Root Cause Analysis tools.
Problem Solving tools.
OEE.
Preventive Maintenance.
Skip to main content


Installation and Setup
Installation - Each User. Installation - Multi-user. Language Translations. Personalize Your Templates.Systems2win Training.
Quick Start Initial Training. New User Training. Training Matrix. Systems2win Leadership. Training Classes.Lean Training
Lean Training and Coaching. Lean Principles. Muda 8 Wastes. Goal - Lean Flow. Roadmap - Lean Journey. Value Stream Mapping. Standard Work. Hansei Lean Thinking. Lean Dictionary. Online Lean Training. Lean Leadership.Microsoft Office Training
Excel Training. Excel Drawings (without Visio). Excel Charts. Word Training. PDF Training. Document Storage and Naming.Support
Support.Decision Matrix template
also known as Impact Effort Matrix, PICK Matrix, Effective Achievable Analysis, Opportunity Analysis, Project Desirability, Project Prioritization, or Project Selection
Your Excel Decision Matrix template (DecisionPICK.xlsx)
plots your alternatives into a chart with 4 visual quadrants,
depicting trade-offs between
- the Impact that an alternative will probably have to achieve your objectives
- and the Achievability of the Effort that will probably be required
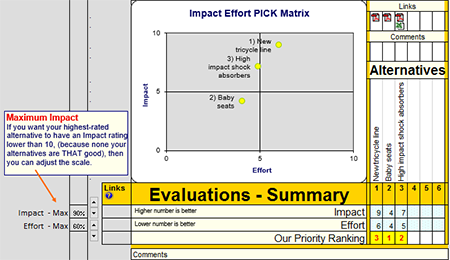
Impact Effort Matrix
This Decision Making Matrix was popularized as a tool for Lean Six Sigma quality improvement
and has become even more popular
as a tool for selection and prioritization of Lean Six Sigma projects.
It is the most popular decision-making tool for any type of business decision making.
Sample Decision Matrix example
Download free trial Excel Decision Matrix
How to reduct conflict using your
Decision Matrix template
Group decision making gets a whole lot easier when your team agrees on a decision-making process
Having an agreed-upon decision-making tool can be particularly useful to counterbalance the personality differences common to almost every group of 2 or more people,
where some people tend to be a little outspoken while others keep their (often better) ideas to themselves.
An Impact Effort Matrix decision-making tool can be especially useful in those uncomfortable moments when you find yourself in the position of being the designated facilitator in a group that happens to include your boss.
Video: Decision Making Tools
Or your boss's boss.
Whether it's your career on the line, or just a mild desire to avoid any possibility of unnecessary conflict...
a skilled group facilitator will become competent using every one of the many types of decision making tools that each are useful for different types of decision-making situations.
How to use your
Decision Matrix template
These instructions are for the Decision Matrix Quadrant Chart (DecisionPICK.xlsx)
Instructions for the simple Decision Matrix template (DecisionSimple.xlsx) are found near the bottom of this page.
Open your template the usual way
Find and open your template
Find and open your Decision Matrix template
(DecisionPICK.xlsx)
in the same way that you find and open your other 150+ Systems2win templates.
If you don't yet own a license, you can download your free trial now.
Save your working document
following the usual document storage and naming conventions established by your leaders
Open a Blank Sheet
When you're ready to start doing your own real work...
click the button to 'Open a Blank Sheet'
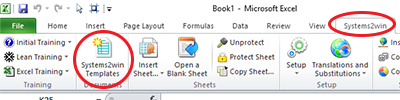
Excel Ribbon > Systems2win tab > Open a Blank Sheet
This blank sheet is where you will do your real work
(not on the Sample sheet — which gives you sample data that is extremely helpful for learning how to use your new tool, but is the wrong place to do your real work)
Rename your new sheet.
If English is not your preferred language
Switch to your language, just like every Systems2win Excel template.
Before getting started using your
Decision Making Matrix
Choose Chart Type
In the dropdown list near the top of the page, choose either:
- Impact Effort PICK Matrix
Higher scores are better for Impact, but lower scores are better for Effort, and the desired quadrant is in the upper left
- Effective Achievable Analysis
Higher scores are better for both Effectiveness and Achievability,and the desired quadrant is in the upper right
Impact Effort Matrix
is the more popular format for a decision making chart
Effective Achievable
is perhaps more intuitive because for both scales a higher score is better and Achievability often considers factors beyond Effort
PACE images from Karen Martin and Associates
Define your rating scales
On the DV sheet, define the rating scales that will appear in the dropdown lists,
perhaps choose from the many popular rating scale options.
Now your team is ready to start using your
Decision Making Excel template
Define the decision that needs to be made
Title
Succinctly summarize the problem in the Title field near the top of the page
Ensure that everyone understands and agrees upon what is to be decided.
List Alternatives
Perhaps use your Values List template, and/or your Hansei questions,
and/or
any of the brainstorming techniques to come up with creative and comprehensive Alternatives.
Reminder:
As with all Systems2win templates...
you can use Link Icons to easily insert intuitive shapes with hyperlinks to related documents
At a minimum, you should link to the Project Charter for each Alternative.
Now skip down to the Details section
As with any Systems2win template... Never edit blue cells that contain formulas.
Those cells will auto-populate when you complete the details section.
Agree upon Objectives
to evaluate proposed solutions to the problem
Objectives
If you are selecting and/or prioritizing Lean Six Sigma Projects see our online training page filled with ideas and examples
of factors to consider for Selection and Prioritization of Lean Six Sigma Projects
To generate additional ideas perhaps use any of the many brainstorming techniques
To clarify, prioritize, and reduce your list perhaps use your Values List template and other list reduction methods
Importance
Assign weight of Importance for each objective in the Impact Rating Section
Usually use a simple 0–10 scale.
You can use any rating scale, as long as larger numbers are more important.
Assign Impact and Effort ratings
Impact and Effort Ratings
In the Impact and Effort ratings grids, use the dropdowns to choose from your team's chosen rating scale.
If you enter a period (.) — that means that your team has agreed that the value is zero.
If a cell is blank — that means that your team has not yet agreed upon a Rating value.
The scores for each column will auto-calculate:
Impact / Effort - Raw Score = Sum of (Impact * Importance)
Impact / Effort - Score - Adjusted = Calculation that sets the highest Raw Score as (10 * Max),
and then all other scores are a percentage of that highest score (rounded to the nearest whole number)
Easily Adjust your Scale
Use the slider controls near the chart to quickly adjust your Maximum values...
because none of your choices are THAT good, or THAT difficult
Try it
Use the slider controls, and see how easy it is to adjust the scale on your chart
Impact / Effort - Other Considerations
Optionally use these sections to itemize objective measures of Impact / Effort that don't fit your usual rating scale.
Impact Examples:
Expected Return On Investment (ROI) — measured in dollars
Yes, your rating scale section might also have a line item for 'ROI' with a 0-10 scale, but it might also be nice to quantify the dollar impacts of each proposed project.
Perhaps refer to linked spreadsheets with detailed cost & ROI analysis.
Time Savings — measured in minutes per shift
Yes, your rating scale section might also have a line item for 'Time Savings' with a 0-10 scale, but it might also be nice to quantify the time savings impacts for each proposed project.
Effort Examples:
Who? — which people or teams might lead each project
Yes, your rating scale section might also have a line item for 'Team Availability' with a 0-10 scale, but it might also be nice to clarify details of who might be needed for 'Leaders', 'Team Members', etc.
Specific Concerns
Yes, your rating scale section might also have a line item for 'Implementation Enthusiasm' with a 0-10 scale, but it might also be nice to clarify details of who might have concerns about what.
Apply chart data labels
Important: A dot will appear on the chart only after you have entered ALL of the required data elements for each row/column:
- Importance rating
- Impact rating
- Effort rating
Important: Data labels will appear next to the dots on the chart only after in the Systems2win menu in the Excel Ribbon bar, you select 'Apply Chart Labels'
Every time that you enter a new Alternative, or change the description of an Alternative...
you will click this button again.
Optional: Choose your desired level of detail for your chart labels
by using the dropdown list near the top of the page to select either:
- Number
- Description
- Both Number and Description
and then select the button again to 'Apply Chart Labels'
Tip: If you want your highest-rated alternative to have an Impact or Effort rating lower than 10, (because none of your alternatives are THAT good, or none are THAT difficult...) then you can optionally use the slider controls to adjust the 'Max' values.
Optional: If you want to temporarily change the format of your chart labels then you can use everything you know about how to format any Excel chart.
Perhaps change font size... Move a label...
Keep in mind, however, that each time that you click the button to Apply Chart Labels ,chart label formats will revert to the default settings.
Evaluate your Alternatives
The Decision Matrix quadrant chart makes it easy to visually see where each alternative falls in the quadrants to Proceed, Investigate, Consider, or Kill, but your team will probably want to use your Impact Effort Matrix as just one element of a less mechanical overall decision-making process.
Facilitate dialog
Talk to each other.
Listen. (really listen)
Perhaps modify and improve upon (or combine) Alternatives.
Allow time for team members to think, ponder, reflect, and consider hansei questions... before regathering to make final decisions.
Make decisions
Our Priority Ranking
After some pleasant genteel discussion,
(or a scratch & claw cat fight... depending on the nature of your team...)
record your decisions in the row for Our Priority Ranking.
#1 is your top priority
Please note that your final Priority Ranking may or may not identically match the calculated Scores, because your team may take into consideration additional factors.
Make plans to implement your priorities
Once your decisions have been made...
your next step is to lay out plans for how to implement your priorities
Templates that might be helpful for project planning might include any of the templates for project management
Socialize your decisions and plans
Like every Systems2win Excel template, you have the choice to print to either paper or PDF.
Notice that you have the choice to print either:
- Just the Summary section, or
- Both Summary and Detailed sections
Learn how to use the Systems2win Print Buttons that are common to many of your Systems2win templates
How to use the simple
Decision Matrix template
The Decision Matrix Quadrant Chart templates (DecisionPICK.xlsx) is the more popular choice, but there are times when you might want to use the simple Decision Matrix template (DecisionSimple.xlsx)
Open your template the usual way
Find and open your template
Find and open your Decision Matrix template
(DecisionPICK.xlsx)
in the same way that you find and open your other 150+ Systems2win templates.
Similarities with Decision Matrix Quadrant template
The simple Decision Matrix template (DecisionSimple.xlsx) is very similar to the Decision Matrix Quadrant Chart template (DecisionPICK.xlsx)
so the instructions are very similar to the instructions in the section above.
Differences
- There are no Effort ratings.
There are only Impact ratings.
You can, however, use some of the (unlimited) user-defined columns to consider factors that affect Effort.
- You can use any scale in the 'Max' field, you can specify any positive number,and the calculated ratings will automatically adjust to that scale.
The default is 10.
If you enter the number 100, then the rating scale will be from 0 to 100.
Learning Experiment: Try it in your own workbook.
This Decision Matrix template and many other decision making tools
come bundled with a lot of other useful Continuous Improvement tools
to empower every team leader
Contents
Process Improvement
Q and A
Ask us a question and see answers to common questions about process improvement.
New User Training
Your Systems2win templates come with free New User Training
to quickly learn features that are common to all 150+ templates
Download Free Trial
If your organization has
not yet provided a license,
download your free trial now

Training and Coaching
Consider Training and Coaching to support your teams to succeed
Training to get you started.
Tools you won't outgrow.
Schedule a Conference
Schedule a conference
to discuss your challenges
with an experienced lean advisor
150+ Templates
Try Some
Own Them All
Download Trial Now
Get a dozen trial templates,
and another dozen free gifts
@@@ Better conversion rate
if call to action is for a specific tool, and shows the image
Try It
Try this template
along with a couple dozen more
process improvement tools
Calls to Action Botttom

Related Topics
Related Topics section WITHOUT TESTIMONIALS
Replace this paragraph with menu library item for topics related to this video
Training and Coaching
Consider Training and Coaching to support your teams to succeed
Training to get you started.
Tools you won't outgrow.
Schedule a Conference
Schedule a conference
to discuss your challenges
with an experienced lean advisor