
Process Improvement Tools.
Standard Work.
Work Instructions.
Flow Chart templates.
Swim Lane Cross Functional Flowchart.
Value Stream Mapping.
Lean tools.
Yamazumi Chart template.
Time Study templates.
DMAIC tools.
Quality Improvement tools.
House of Quality QFD.
FMEA Risk Reduction.
Root Cause Analysis tools.
Problem Solving tools.
OEE.
Preventive Maintenance.
Skip to main content


Installation and Setup
Installation - Each User. Installation - Multi-user. Language Translations. Personalize Your Templates.Systems2win Training.
Quick Start Initial Training. New User Training. Training Matrix. Systems2win Leadership. Training Classes.Lean Training
Lean Training and Coaching. Lean Principles. Muda 8 Wastes. Goal - Lean Flow. Roadmap - Lean Journey. Value Stream Mapping. Standard Work. Hansei Lean Thinking. Lean Dictionary. Online Lean Training. Lean Leadership.Microsoft Office Training
Excel Training. Excel Drawings (without Visio). Excel Charts. Word Training. PDF Training. Document Storage and Naming.Support
Support.Cause and Effect Matrix
Cause and Effect template using familiar Microsoft Excel
Cause and Effect template
Purpose: to identify what your customers care about
To identify the few process input variables that provide the greatest opportunity to improve the process outputs that your customers care about most
This simple Six Sigma tool answers the same questions as the (also easy to use) Measurement Selection Matrix, and the (much more thorough) QFD House of Quality template
"What should we measure — that our customers care about?"
and...
"Where should we focus our attention — to give our customers the most satisfaction for an acceptable cost?"
Video:
Introduction to QFD
& Cause and Effect Matrix
Sample Cause and Effect Matrix example
How to use your
Cause & Effect Matrix template
Find and open your template
Find and open your Cause and Effect Matrix template
(CauseEffect.xlsx)
in the same way that you find and open your other 150+ Systems2win templates.
Save your working document
following the usual document storage and naming conventions established by your leaders
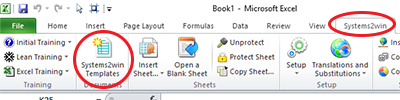
Open a Blank Sheet
When you're ready to start doing your own real work...
click the button to 'Open a Blank Sheet'
Excel Ribbon > Systems2win tab > Open a Blank Sheet
This blank sheet is where you will do your real work
(not on the Sample sheet — which gives you sample data that is extremely helpful for learning how to use your new tool, but is the wrong place to do your real work)
Rename your new sheet.
If English is not your preferred language
Switch to your language, just like every Systems2win Excel template.
Now your team is ready to start using your
Cause and Effect Matrix
Step 1) Identify key customer requirements (process outputs)
Use 'Voice of the Customer' worksheets to identify KEY requirements.
Usually, you will work with less than 7 key requirements.
Hide unused columns.
Is it your job to put out fires?
or to prevent them?
Step 2) Rate importance to customer
If you use a scale other than the usual 1-10 scale, edit the text box to explain your rating scale. (Whole numbers only)
Important: The Pareto Chart won't work without ALL data entered — including 'Importance to Customer'
Step 3) Enter the process inputs (steps)
Copy your As Is worksheet to serve as the starting point for your To Be version.
Step 4) Enter correlations
Enter your team's rating of correlations between inputs and outputs
Optionally use the text box to explain your team's rating scale.
In version 12 and lower, you need to click the 'Pareto Refresh' button
In version 13, this is no longer needed.
Step 5) Focus your attention
to improve the processes with the highest total scores
These are the inputs with the most potential for making improvements that your customers care most about.
Allow people time to think, ponder, and reflect, and encourage them to return (again and again) to the Hansei questions to stimulate Lean Thinking.
How to Add and Move Rows
You can add as many rows as you need above the bottom thin gold line.
Don't just 'Insert Rows'
To add rows, use the 'Add Rows' button in the Systems2win menu in the Excel Ribbon bar.
and to Copy or Move rows, use use Insert Copied Cells and Insert Cut Cells (see training video)
If you haven't already...
watch this training video to learn the most important Excel skills that you will ever learn
Excel training video
Add, Copy, or Move rows
This Cause and Effect Matrix template comes with many other useful Six Sigma tools, and tools for Design for Six Sigma
New User Training
Your Systems2win templates come with free New User Training
to quickly learn features that are common to all 150+ templates

Own Yours Now
Own your own professional tools
that you can take with you for the rest of your career
150+ Templates
Try Some
Own Them All
Download Trial Now
Get a dozen trial templates,
and another dozen free gifts
@@@ Better conversion rate
if call to action is for a specific tool, and shows the image
Try It
Try this template
along with a couple dozen more
process improvement tools
Calls to Action Botttom

Related Topics
Related Topics section WITHOUT TESTIMONIALS
Replace this paragraph with menu library item for topics related to this video
Training and Coaching
Consider Training and Coaching to support your teams to succeed
Training to get you started.
Tools you won't outgrow.
Schedule a Conference
Schedule a conference
to discuss your challenges
with an experienced lean advisor