
Process Improvement Tools.
Standard Work.
Work Instructions.
Flow Chart templates.
Swim Lane Cross Functional Flowchart.
Value Stream Mapping.
Lean tools.
Yamazumi Chart template.
Time Study templates.
DMAIC tools.
Quality Improvement tools.
House of Quality QFD.
FMEA Risk Reduction.
Root Cause Analysis tools.
Problem Solving tools.
OEE.
Preventive Maintenance.
Skip to main content


Installation and Setup
Installation - Each User. Installation - Multi-user. Language Translations. Personalize Your Templates.Systems2win Training.
Quick Start Initial Training. New User Training. Training Matrix. Systems2win Leadership. Training Classes.Lean Training
Lean Training and Coaching. Lean Principles. Muda 8 Wastes. Goal - Lean Flow. Roadmap - Lean Journey. Value Stream Mapping. Standard Work. Hansei Lean Thinking. Lean Dictionary. Online Lean Training. Lean Leadership.Microsoft Office Training
Excel Training. Excel Drawings (without Visio). Excel Charts. Word Training. PDF Training. Document Storage and Naming.Support
Support.Critical To Quality
Tree diagram templates for Critical to Quality, Critical to Satisfaction, and Measurement Assessment
'Critical To' Tree Diagrams
There are 2 types of 'Critical To' Tree Diagrams,
and your Critical To Quality template (TreeCritical.xlsx) can be used for both
1) Critical to Satisfaction Tree Diagram
A Critical to Satisfaction Tree Diagram starts with a single output that is important to customer satisfaction for the product or service being analyzed,
choosing a single output from the SIPOC diagram that your team already created for this same process
and then breaks down the hierarchical layers of characteristics that affect that output, with the lowest layer identifying specific Elements that can be objectively measured.
A Critical to Customer Satisfaction Tree Diagram might identify product or service characteristics that are:
- Critical to Quality
- Critical to Delivery
- Critical to Cost
You will use this one template
in many ways
2) Critical to Process Tree Diagram
also known as a Process Flowdown
A Critical to Process Tree Diagram starts with a complex process
(such as 'Order Fulfillment', or 'Purchase Requisitions', or 'Employee Hiring'...)
and then breaks down the hierarchical layers of systems and sub-systems that together comprise the complex process being analyzed, with the lowest layer identifying specific Elements that can be objectively measured.
Measurement Assessment Tree Diagram
Use your Measurement Assessment template
to dive deeper
Once you have used your 'Critical To' Tree Diagram template to identify the quality, delivery, cost, and/or process characteristics that are critical the satisfaction of your customers' needs...
then your team might also want to use your Measurement Assessment Tree Diagram template to identify and stratify data that is (and is not) worth measuring and controlling.
This web page contains step-by-step training for both
1) Your 'Critical To' Tree Diagram template
2) Your Measurement Assessment Tree Diagram template
How to use your
Critical To Quality template
Find and open your template
Find and open your Critical To Quality Tree template
(TreeCritical.xlsx)
in the same way that you find and open your other 150+ Systems2win templates.
Save your working document
following the usual document storage and naming conventions established by your leaders
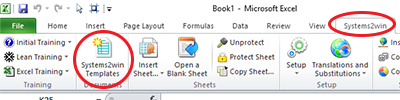
Open a Blank Sheet
When you're ready to start doing your own real work...
click the button to 'Open a Blank Sheet'
Excel Ribbon > Systems2win tab > Open a Blank Sheet
This blank sheet is where you will do your real work
(not on the Sample sheet — which gives you sample data that is extremely helpful for learning how to use your new tool, but is the wrong place to do your real work)
Rename your new sheet.
If English is not your preferred language
Switch to your language, just like every Systems2win Excel template.
Now your team is ready to start using your
Critical-To-Quality Excel template
Use what you know about Excel Tree Diagrams
Follow the on-line instructions for how to use any Excel Hierarchy Diagram template.
Suggested workflow sequence:
- Insert primary shapes first
without worrying much about colors, fonts, & formatting
- Resize workspace as needed
a) row & columns, b) Print Area, c) drawing space
- Apply formatting as the last thing you do
Training video: Tree Diagram
Identify sub-levels
Perhaps use Brainstorming and Affinity Grouping to identify and agree upon a hierarchical structure of sub-levels.
If this is a Critical to Satisfaction tree these sub-levels are characteristics of the product or service output that are critical to quality, delivery, or cost.
If this is a Critical to Process tree these sub-levels are the systems and sub-systems that comprise the layers of the complex process being analyzed.
Do a 'necessary and sufficient' check
1) Ask...
Is meeting each of these characteristics necessary for the customer to be satisfied that the desired output is fulfilled?
If a characteristic is not necessary—remove it.
2) Ask...
Is meeting all of these characteristics sufficient for the customer to be satisfied that the desired output is fulfilled?
If not sufficient—identify what is missing, and add it.
Identify Data Elements
also know as 'Characteristics'
Perhaps use Brainstorming and/or Affinity Grouping to identify and agree upon Data Elements.
A 'Data Element' is any way of objectively (or even subjectively) measuring the effectiveness or efficiency of any:
- 'Critical To' characteristic (for a Critical to Satisfaction tree)
- Sub-system (for a Critical to Process tree)
Stratification Layers
It is NOT necessary (or usually desirable at this stage) to further break down the Data Elements into Stratification Layers.
In a later step, you can use your Measurement Assessment Tree template to identify Stratification Layers for only those measures that your team chooses to actually measure and control.
Example of a Data Element might be...
Time to respond to a customer service inquiry.
Examples of Stratification Layers might be…
By customer service rep. By geographic region. By customer type. By type of inquiry.
Internet vs. telephone inquiries...
Choose which Data Elements to measure & control
Use a formal team decision-making process to choose the Data Elements to measure & control,
perhaps using one or more of the following tools as decision-making and consensus-building aids:
- One or more of your Measurement Selection Tools
- One or more of your Decision Making Tools
- Measurement Assessment Tree
Choose the right Process Improvement Tools
for Measurement Selection
Establish measurable goals
Establish measurable goals for each Data Element.
How to use your
Measurement Assessment Tree template
Find and open your template
Find and open your Measurement Assessment Tree Diagram
(MeasuresTree.xlsx)
in the same way that you find and open your other 150+ Systems2win templates.
Save your working document
following the usual document storage and naming conventions established by your leaders
Open a Blank Sheet
When you're ready to start doing your own real work...
click the button to 'Open a Blank Sheet'
Excel Ribbon > Systems2win tab > Open a Blank Sheet
This blank sheet is where you will do your real work
(not on the Sample sheet — which gives you sample data that is extremely helpful for learning how to use your new tool, but is the wrong place to do your real work)
Rename your new sheet.
If English is not your preferred language
Switch to your language, just like every Systems2win Excel template.
Now your team is ready to start using your
Measurement Assessment template
Use what you know about Excel Tree Diagrams
Follow the on-line instructions for how to use any Excel Hierarchy Diagram template.
Suggested workflow sequence:
- Insert primary shapes first
without worrying much about colors, fonts, & formatting
- Resize workspace as needed
a) row & columns, b) Print Area, c) drawing space
- Apply formatting as the last thing you do
Training video: Tree Diagram
Identify a single important Output (Y)
Identify a single output (Y) that is important to customers and write it in the single node at the top of the chart diagram
(just below the top-level text boxes)
Tip: You might create multiple worksheets to analyze multiple outputs.
Ask your questions
Define the questions that you would like to understand about that output and enter those questions in the top-level text boxes.
Potential tools & methods to identify and agree upon questions:
Identify Stratification Factors (X Variables)
You'll get a lot more out of this training if you have your template open in front of you
Refer to the help text boxes on the Sample sheet
Identify Stratification Factors (X Variables) and enter them in the layer beneath the (Y) Output
Definition of a Stratification Factor = The ways that you want to analyze your data to possibly reveal meaningful patterns.
Perhaps again use Brainstorming and/or Affinity Grouping.
Conceive specific Metrics
Come up with ideas for specific Metrics and add them in boxes beneath each Stratification Factor
Metrics must be observable and measurable.
Just summarize each metric with a very brief title here.
Use your Operational Definitions worksheet to define very clear definitions and procedures for each metric.
(Perhaps add a link to the Operational Definitions worksheet.)
Determine whether data exists
Review each measure (each metric and the Y output) and determine whether the data exists, or whether special data collection will be required.
Use your team's user-defined formatting system to differentiate which data does and does not exist.
(and personalize the Legend text box to explain your formatting)
Determine whether each metric will help predict the outcome (Y)
Use your team's user-defined formatting system to differentiate which metrics will and will not help predict the outcome (Y).
This Critical To Quality template
comes with many other useful Lean Six Sigma Tools and DMAIC Tools
to empower every team member
New User Training
Your Systems2win templates come with free New User Training
to quickly learn features that are common to all 150+ templates
The right DMAIC tools
to Define, Measure, Analyze, Improve, and Control
the quality of ANY process
Own Yours Now
If your organization has
not yet provided a license,
own yours now
150+ Templates
Try Some
Own Them All
Download Trial Now
Get a dozen trial templates,
and another dozen free gifts
@@@ Better conversion rate
if call to action is for a specific tool, and shows the image
Try It
Try this template
along with a couple dozen more
process improvement tools
Calls to Action Botttom

Related Topics
Related Topics section WITHOUT TESTIMONIALS
Replace this paragraph with menu library item for topics related to this video
Training and Coaching
Consider Training and Coaching to support your teams to succeed
Training to get you started.
Tools you won't outgrow.
Schedule a Conference
Schedule a conference
to discuss your challenges
with an experienced lean advisor