Installation and Setup
Installation - Each User. Installation - Multi-user. Language Translations. Personalize Your Templates.Systems2win Training.
Quick Start Initial Training. New User Training. Training Matrix. Systems2win Leadership. Training Classes.Lean Training
Lean Training and Coaching. Lean Principles. Muda 8 Wastes. Goal - Lean Flow. Roadmap - Lean Journey. Value Stream Mapping. Standard Work. Hansei Lean Thinking. Lean Dictionary. Online Lean Training. Lean Leadership.Microsoft Office Training
Excel Training. Excel Drawings (without Visio). Excel Charts. Word Training. PDF Training. Document Storage and Naming.Support
Support.Fishbone Diagram template
for Root Cause Analysis
aka fishbone template, fish diagram, Ishikawa diagram, cause and effect diagram
Why do Root Cause Analysis?
To gain clearer understanding of possible root causes
and to brainstorm ideas for creative solutions to the problem
Why use a Root Cause Analysis template?
For the same reasons that you use any software...
- To have a standardized process
with helpful training to remind your team of all the factors to consider every time that you use any root cause analysis tools
- To be legible
and understandable, even to people who didn't participate in drawing it
- To socialize your results
with an Excel file or PDF that can be shared, discussed, and socialized

and test drive
the special feature
to import already-known causes
from your FMEA template
Your fishbone diagram template
makes it easy to:
- Quickly record people's ideas
as fast as they can generate them with 'handwriting' that everyone can read!
- Keep asking "why?"
until you arrive at root causes of your problem so that you can 'dig out the roots' instead of 'hacking at the leaves'
- Easily rearrange ideas
into logical groups spawning even better ideas

Why use tools?
I'm paid by the hour.
And when the cause and effect analysis session is over...
everyone can get right back to work
because everything is perfectly organized in your fishbone diagram, ready to email to and socialize with all team members, and to store electronically for future reference.
How to use your
Fishbone template
Make sure you chose the right template
Your first step is to choose the right Root Cause Analysis Tool.
Find and open your template
Find and open your Root Cause Analysis Fishbone template
(RootCause.xlsx)
in the same way that you find and open your other 150+ Systems2win templates.
If you don't yet own a license,
you can download your free trial now.

Save your working document
following the usual document storage and naming conventions established by your leaders
Open a Blank Sheet
When you're ready to start doing your own real work...
click the button to 'Open a Blank Sheet'
Excel Ribbon > Systems2win tab > Open a Blank Sheet
This blank sheet is where you will do your real work
(not on the Sample sheet — which gives you sample data that is extremely helpful for learning how to use your new tool, but is the wrong place to do your real work)

Rename your new sheet.
Or... Insert Sheet
As an alternative to opening a stand-alone document (as instructed above), you also have the option to Insert Sheet into any other Excel workbook.
If English is not your preferred language
Switch to your language, just like every Systems2win Excel template.
Now your team is ready to start using your
Fishbone Diagram template
How to quickly expand your workspace
by simply unhiding pre-formatted rows and columns
The most important thing to know about this fishbone template is that
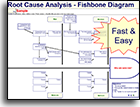
it is FAST to use
In the heat of a group brainstorming session, there is no time for complex or temperamental root cause analysis software.
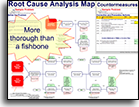
If you want a more thorough root cause analysis tool...

try using your Root Cause Analysis Mapping template (RootMap.xlsx)
With your Systems2win fishbone diagram template (RootCause.xlsx), you can quickly copy similar cells, quickly drag n drop, quickly move things around, quickly resize boxes to quickly whip up a professional-looking completed fishbone diagram, and still have time to join the rest of your team for lunch.

Sample root cause analysis example
Download free trial fishbone diagram template
Notice that you can easily connect multiple arrows in multiple directions to depict causes that have multiple effects and effects that have multiple causes.
Because that's the way the real world works... right?
Things are rarely as linear and rigid as the thinking of most computer programmers.
Affinity Groups
You can easily re-label the yellow text boxes to organize your fishbone diagram branches into any Affinity Groups that are most helpful for the problem you are solving.
For example, rather than the 4 M's illustrated in the example, (Man, Machine, Materials, and Methods), you might instead choose 4 P's, 8 P's, or 4 S's that are more popular for service processes, or headings popular for FMEA's, or DOE Design of Experiments...
See the full list of popular Affinity Group headings.
How to quickly copy shapes
Master the teachings found in:
- The training videos: How to use Excel as a drawing tool

- The written online training: Tips for using Microsoft Office Drawings.
Helpful Tips
- It's easier to copy & paste an entire cell (containing a text box and arrow) rather than copying text boxes and arrows separately.
- Use your snap-to grid.
- You can quickly expand your workspace by simply unhiding pre-formatted rows and columns.
- Notice that you can easily connect multiple arrows in multiple directions to depict causes that have multiple effects and effects that have multiple causes. (Because that's the way the real world works... right?)
- Use colors to communicate!!!
- Use the stencil of shapes to highlight, circle, and call attention to important things.
- Use bursts and clouds to identify problems and solutions.

Two popular ways to use your
Root Cause Fishbone template
You can either:
1) Use a projector
and make the changes where everyone can see them.
2) Use sticky notes on the wall
while an assistant transcribes the results into a more legible version that can then be used for easier editing and Affinity Grouping, and can be electronically archived and emailed to participants after the meeting.
Either way...
Months or years from now — when a similar problem arises...
it's easy for your team leaders to retrieve your electronically stored fishbone diagram and pick up where you left off.
Easily answer the question
"What were our thoughts when we last considered a similar problem?"
Two popular ways to do
Brainstorming
You can either:
- Do all of your brainstorming right on the Root Cause Analysis template (RootCause.xlsx)
Once you know how to use Excel as a drawing tool, then the learning curve for this root cause template takes only a few minutes
(because it is so similar to all of your other Systems2win Excel drawing tools for continuous improvement).
- Or do your initial brainstorming using your Brainstorming template (brainstorming.docx)

that makes it so easy to re-arrange your ideas into Affinity Groups
Either way...
- Follow the instructions for brainstorming
- Continue asking "why" until root causes are found
- When you archive your results —
Unless there is some reason to clean it up, you can usually just archive it the messy "way it is".That's the beauty of human beings. They will "get the picture", and your people can quickly move on toward actually solving your root problems.
5 Whys
"A relentless barrage of 'why’s' is the best way to prepare your mind to pierce the clouded veil of thinking caused by the status quo. Use it often."
~ Shigeo Shingo
Time saving bonus feature of your
Fishbone Diagram template
When you are preparing to lead a root cause analysis brainstorming session
for a mature process that already has many already-known causes...
You can optionally import already-known causes
- From your PFMEA or DFMEA
- From a Systems2win brainstorming template (Tip: copy from Word to Excel, then import)
- From any Excel workbook
Instructions for how to Import Data to your Fishbone Template
Optional Step 1) Format the 'Import Master Textbox'
Use everything you know about how to format Excel shapes
to format the 'Import Master Textbox' with the desired fonts, colors, or patterns that you want for the boxes that will contain your imported data.
(to visually differentiate your imported data from the new ideas that your team will soon generate)
Important: Do not move, copy, or delete the Import Master Text Box. It should remain snapped to the upper left corner of the cell with the dotted border.

Tip: Even if you don't format the Import Master Textbox, you can still identify imported text boxes by viewing their Alt Text.
Step 2) Import Data
In the Systems2win menu, select 'Import Data' then browse to select the data range(s) to import
(which might be in another Excel workbook)
Tip: You can use everything you know about how to select cells in Excel, using the Shift or Control keys to select non-continguous ranges.
After selecting the data range(s) that you want to import, go back to your original Root Cause workbook, where the dialog window will still be showing, and select 'OK'.
Scroll to the right of your Fishbone workspace to find all of the newly imported text boxes, which you can now drag into your workspace - first using Snap To Grid to snap the square shapes into place, and then disabling Snap To Grid when you're ready to add your connector arrows.
This fishbone diagram template comes with many other useful Root Cause Analysis tools and Lean Six Sigma tools
Contents
New User Training
Your Systems2win templates come with free New User Training
to quickly learn features that are common to all 150+ templates

Standardized tools?
Oh no, man, everyone just
does their own thing
around here
Schedule a Conference
Schedule a conference
to discuss your challenges
with an experienced lean advisor
Download Trial Now
Get a dozen trial templates,
and another dozen free gifts
@@@ Better conversion rate
if call to action is for a specific tool, and shows the image

Try It
Try this template
along with a couple dozen more
process improvement tools
Calls to Action Botttom
Related Topics
Related Topics section WITHOUT TESTIMONIALS
Replace this paragraph with menu library item for topics related to this video
Training and Coaching
Consider Training and Coaching to support your teams to succeed

Training to get you started.
Tools you won't outgrow.
Schedule a Conference
Schedule a conference
to discuss your challenges
with an experienced lean advisor


