
Process Improvement Tools.
Standard Work.
Work Instructions.
Flow Chart templates.
Swim Lane Cross Functional Flowchart.
Value Stream Mapping.
Lean tools.
Yamazumi Chart template.
Time Study templates.
DMAIC tools.
Quality Improvement tools.
House of Quality QFD.
FMEA Risk Reduction.
Root Cause Analysis tools.
Problem Solving tools.
OEE.
Preventive Maintenance.
Skip to main content


Phase 2) Draw your


Installation and Setup
Installation - Each User. Installation - Multi-user. Language Translations. Personalize Your Templates.Systems2win Training.
Quick Start Initial Training. New User Training. Training Matrix. Systems2win Leadership. Training Classes.Lean Training
Lean Training and Coaching. Lean Principles. Muda 8 Wastes. Goal - Lean Flow. Roadmap - Lean Journey. Value Stream Mapping. Standard Work. Hansei Lean Thinking. Lean Dictionary. Online Lean Training. Lean Leadership.Microsoft Office Training
Excel Training. Excel Drawings (without Visio). Excel Charts. Word Training. PDF Training. Document Storage and Naming.Support
Support.Root Cause Analysis template
RCA template for cause mapping of root cause failure analysis
Why do Root Cause Analysis?
To gain clearer understanding of possible root causes, and to brainstorm ideas for creative solutions to the problem.
Why use a Root Cause template?
For the same reasons that you use any software
- To be legible
and understandable, even to people who didn't participate in drawing it
- To socialize your results
with an Excel file or PDF that can be shared, discussed, and socialized
- To have a standardized process, with helpful training
to remind your team of all factors to consider every time you do root cause analysis
Download your free trial
Root Cause template
How to use your
Root Cause Analysis template
Choose the right root cause analysis tool
Before getting started, review this helpful training to choose the right Root Cause Analysis tool.
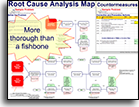
The Root Cause Analysis Map is the most popular.
Here are the detailed instructions for how to use it..
Before getting started
Your leaders might have already personalized the DV sheet in your master template so that you are starting with typical drop down lists for YOUR company.
If you are launching a new team, then use the same lean leadership tools and systems that you use to launch any team.
Find and open your template
Find and open your Root Cause Analysis Map template
(RootMap.xlsx)
in the same way that you find and open your other 150+ Systems2win templates.
If you don't yet own a license, you can download your free trial now.
Save your working document
following the usual document storage and naming conventions established by your leaders
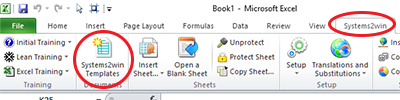
Open a Blank Sheet
When you're ready to start doing your own real work...
click the button to 'Open a Blank Sheet'
Excel Ribbon > Systems2win tab > Open a Blank Sheet
This blank sheet is where you will do your real work
(not on the Sample sheet — which gives you sample data that is extremely helpful for learning how to use your new tool, but is the wrong place to do your real work)
Rename your new sheet.
Or... Insert Sheet
As an alternative to opening a stand-alone document (as instructed above), you also have the option to Insert Sheet into any other Excel workbook.
If English is not your preferred language
Switch to your language, just like every Systems2win Excel template.
Now your team is ready to start using your
Root Cause Mapping template
Get Oriented
Notice that your Cause Mapping template is divided into 3 sections:
- The primary drawing area
where you draw your root cause analysis map
- The optional section for Problem Analysis
and notice that there are special links to quickly jump back and forth between the Problem Analysis section and the Top section
- Countermeasures
just to the right of the primary drawing area
Print Areas
You can use the special Systems2win buttons
to print each of the 3 sections.

In addition to the special print buttons for the 3 print areas, you can also use Excel normal Printing features
For example, if your use CTRL+P, then (as delivered) the Print Area will include both:
- the primary drawing area (Print Area 1)
- and the section for Countermeasures (Print Area 3)
And you can also use everything else that you you know or learn about Microsoft Excel Printing features to perhaps change the default Print Area to include or exclude the Countermeasures section.
Hide unused rows and columns
You can use everything that you know about familiar Microsoft Excel to easily hide unused columns in the drawing area or to hide individual rows or entire unused sections in the Problem Analysis area
Because rows are shared with the primary drawing area and the Countermeasures section, there are special instructions for how to add, delete, or resize row heights in the Countermeasures section. (as explained in the training below)
Familiar Microsoft Excel
Use everything you know about familiar Word and Excel
Root Cause template
Phase 1) Define the Problem
Enter header data
Title
Enter a brief description of the primary purpose of this document.
The Title that you enter in the main drawing section will also populate the Title fields
in the other 2 sections for Problem Analysis and Countermeasures.
To change date format
Right-click > Format Cells > Number tab
Notice that Revised Date can be different in each section.
Other Header Data
Each section has a field where you can enter any other header data that you want at the top of that section.
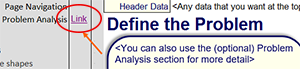
Define the Problem
Use the text box to summarize the most important aspects of the problem.
You can also follow the link to the optional Problem Analysis section for more detail.
Text box for any other Pertinent Information
Use the extra text box to provide any other helpful information.
Most commonly, you will list the document Author and team members in this text box.
Tip: You can use everything you know about familiar Microsoft Excel.
You can move the text box anywhere. Or copy it for multiple text boxes. Or delete it...
Tip: Rather than duplicating Team Contact Information in multiple documents, it is often more efficient and effective to provide a Link to a central document containing contact info.
Use the (optional) Problem Analysis section for
Root Cause Failure Analysis
Page Navigation
Like many of your Systems2win templates, you can use the Navigation Links to quickly jump to the Problem Analysis section and back to the Top
Everything in the Problem Analysis section is optional
Simply hide unused rows, or hide entire sections.
When
There are several optional rows to clarify 'When':
- Date and Time
To change date or time format:
Right-click > Format Cells > Number tab - Task or Requirement
If there is a task that triggers this problem, or conditions that must be present to trigger the problem, then you can describe those here.
Where
Optionally clarify the Location(s) and/or Work Area(s) where this problem happens.
or where the incident happened
Goals Impacted
Describe the Impact of this Problem for each of your Goals.
Simply hide rows for goals that are not impacted.
For any user-defined goals — optionally overwrite the VLOOKUP formula with your own text.
Cost
You can optionally attempt to estimate the cost impacts of this problem.
To change the currency symbol: Right-click > Format Cells > Number tab
To change Frequency: Enter your desired frequency in the pink cell. (year, month, week...)
Timeline
To analyze a problem incident, it is sometimes helpful to create a timeline of what happened in what sequence.
Or you can simply hide rows for this entire optional section.
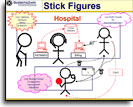
Pictures and Charts
Unhide this optional section to show any pictures, flow charts, or other illustrations to help clarify the problem.
Helpful training:
- How to use Excel as a drawing tool
- How to Copy as Picture
Popular templates to use for illustrations:
Action List for Information Gathering
If your team needs to divvy up & track responsibilities to gather information during your Problem Solving phase...
remember that you can always use Insert Sheet to insert a familiar worksheet into any workbook...
for an Action List, or a To Do List, or Bowling Chart, or a Gantt Summary...
Revision Tracking
Some Root Cause Analysis projects get so long and drawn out that they can benefit from a Revision Tracking System.
Reminder: With your Systems2win Excel add-in installed, you can always use Insert Sheet to insert a RevLog worksheet into ANY Excel workbook that you believe might benefit from revision control.
Optional Report Out
Like every other type of process improvement project...
your senior lean leadership might request a Status Report session at the end of each phase of any project that takes more than a day.
And (as always) your PowerPoint Presentation of Results template and/or A3 Report template provide a useful balance of:
- Guidance to ensure that your presentation includes all of the elements that it should... and
- Freedom to format your presentations with infinite flexibility and creativity
When you have completed the Problem Analysis phase to the satisfaction of your team or often more importantly, to the satisfaction of the stakeholders affected by this problem then you are ready to begin Phase 2...
Root Cause Mapping template
Phase 2) Draw your
Root Cause Analysis Map
Start with Goals Impacted
There should (eventually) be a red box for each of the Goals Impacted.
If you used the (optional) Problem Analysis section, then you will now create a red box in the drawing area for each of the Goals Impacted (that you have already identified).
Unlike a Root Cause Fishbone Diagram a Cause Map can optionally have more than one Impacted Goal on a single sheet each with their own branches of Causes and Effects, and perhaps some of those branches intermingling.
Here's where the art of root cause mapping comes in...
Some people like to use a separate page for each Goal Impacted.
Some people like to start with separate pages, and then merge them later.
Some people like to analyze them all on one page, but one at a time.
Others like to add a red box for every Goal Impacted - right away.
Add boxes for Cause and Effects
The first box
The first box to the right of each Impacted Goal answers the question:
"Why was this Goal impacted?"
or "In what way was this Goal impacted?"
Keep asking "Why?"
Keep adding more Cause and Effects boxes until you reach root causes.
Provide Evidence (optional)
You can optionally add a red 'Evidence' shape beneath any Cause box - to provide supporting Evidence.
And remember that you can always use Link Icons to provide links to related documents.
Arrows and Connectors
Use everything you know about Arrows and Connectors
which are always the same in any drawing created using Microsoft Excel, Word, or PowerPoint, so you can leverage your skills when creating drawings using any of these 3 interchangeable drawing tools
(which are completely different from Visio, or any other 3rd party drawing software)
Drawing Tips:
You'll get a lot more out of this training if you have your template open in front of you
See the Sample sheet for examples, pop-up help, Excel tips, and other training aids
Use Snap To Grid for large shapes
then toggle Snap To Grid off — to add text boxes and connector arrows
To switch between elbow, straight, or curved connectors,
Right-click an arrow, then select 'Connector Type'
Right-click a shape > Bring to Front, or Send to Back
Learn how to use Excel as a Drawing Tool
And/Or
It is sometimes helpful to copy the clear text labels to clarify some Causes that are related...
with either And, Or, or And/Or
Section Headings (optional)
You can also copy the optional Section Headings for:
Man, Machine, Methods, Materials, Measures, or Mother Nature (Environment)
(or any user-defined section headings)
Section Labels are optional.
Even if you don't use them, they can provide a useful reminder to consider possible causes in each of the primary categories.
International global teams...
Notice that many of the text labels are translated so that they still make sense even when you switch between languages
When you have completed the drawing section of your Root Cause Analysis template to the satisfaction of your team, management, and stakeholders then you are ready to begin Phase 3...
RCA template
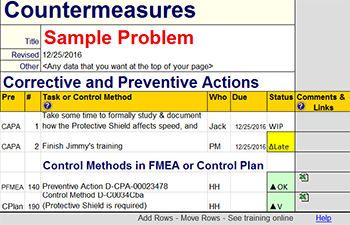
Phase 3) Countermeasures
Brainstorm Countermeasures
Think
The ultimate purpose of every lean tool and method is to stimulate human thinking.
As always, the questions on the Hansei page can help stimulate better ideas.
Your team leader might also choose to facilitate brainstorming.
Prefix and Reference Number
In the green shape above each Cause box, optionally refer to the reference numbers in the Countermeasures section.
The first two columns in the Countermeasures section are 'Prefix' (Pre) and 'Number' (#)
Use prefixes to refer to line items in different documents.
For example:
Perhaps use the prefix 'CAPA' if only documented here
in this Countermeasures table for Corrective And Preventive Actions
and perhaps use the prefix of 'PFMEA' or 'CPlan' to refer to a Process Step number in an FMEA or Control Plan.
(and then perhaps use a Link Icon to allow your users to quickly open the related document)
Task or Control Method
BRIEF description of the CAPA Task or the Control Method that is detailed in an FMEA or Control Plan.
Important Tip: Resizing row height will affect images in the drawing.
so study this training about word wrap...
Word Wrap (without distorting shapes)
Explanation of the Problem
In order to allow the option to include the Countermeasures section in a single Print Area along with the primary drawing area...
the compromise is that if you change row heights in the Countermeasures section, shapes might be affected in the drawing area.
Alternative Solutions
- Row heights have been specially formatted so that rows remain the same height (25.5)
even when you enter longer wrapped text.
If you leave row heights alone, then the first 2 rows of text will be visible, and Excel users can select the cell to see the rest of the text (in the Formula bar).
- Resize row heights anyway
If there are no shapes sharing the rows that you want to resize... then there is no problem.
You might go ahead and resize row height to fit your word wrapped text.Or... if there are shapes in that row...
you might temporarily move those shapes out of the way, then resize the row height, then move the shapes back into the drawing area. - Rather than entering such long text, you might instead:
a) Refer to the Comments text box
b) Use the Comments cell (that is outside of the Print Area)
(Just be sure not to use word wrap in that cell either)
c) Use Cell Comments
d) Link to related documents
- Use a text box instead of entering data into cells Just outside of the print area, you will find a text box that has been preformatted for this purpose.
Simply drag that text box into the print area, and use snap to grid to make it fit perfectly...
and then you don't have to worry about word wrap affecting row heights
Or add your own text box anywhere within the print area and use it to document your proposed and chosen Countermeasures.
How to Add or Move Rows (in the Countermeasures section)
You can use Insert Copied Cells (or Move Cut Cells).
(Remember in New User Training, we said that this was the single most important Excel skill that you will ever learn?)
but unlike most situations...
where you usually want to move or copy only entire rows...
this is one situation where you want to move or copy only the cells in the Countermeasures section
(thereby leaving the entire drawing area unaffected)
Excel training video
Add, Copy, or Move
rows, columns, or cells
Who and Status
Like so many of your other Systems2win templates, you can define options for your user-defined dropdown lists on the DV sheet.
Due
Line items that don't have a Status of 'Done' (or something similar) should have a Due Date.
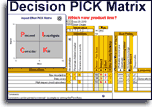
Make Decisions
Choose which Countermeasures to implement, perhaps using some of your Decision Making Tools
Implement and Verify
Use your Lean Management tools and skills to Measure Results and verify that your Countermeasures actually work as expected.
Root Cause Analysis template
with many other useful Root Cause Analysis Tools for Lean, Six Sigma and Quality Improvement
New User Training
Your Systems2win templates come with free New User Training
to quickly learn features that are common to all 150+ templates
Contents
The right DMAIC tools
to Define, Measure, Analyze, Improve, and Control
the quality of ANY process
Own Yours Now
If your organization has
not yet provided a license,
own yours now
Training and Coaching
Consider Training and Coaching to support your teams to succeed
Training to get you started.
Tools you won't outgrow.
Schedule a Conference
Schedule a conference
to discuss your challenges
with an experienced lean advisor
No, we're not going to
buy you any tools...
but we don't want any excuses when those deadlines are due
Own Yours Now
Own All 150+ Templates for
Continuous Process Improvement
150+ Templates
Try Some
Own Them All
Download Trial Now
Get a dozen trial templates,
and another dozen free gifts
@@@ Better conversion rate
if call to action is for a specific tool, and shows the image
Try It
Try this template
along with a couple dozen more
process improvement tools
Calls to Action Botttom

Related Topics
Related Topics section WITHOUT TESTIMONIALS
Replace this paragraph with menu library item for topics related to this video
Training and Coaching
Consider Training and Coaching to support your teams to succeed
Training to get you started.
Tools you won't outgrow.
Schedule a Conference
Schedule a conference
to discuss your challenges
with an experienced lean advisor