
Process Improvement Tools.
Standard Work.
Work Instructions.
Flow Chart templates.
Swim Lane Cross Functional Flowchart.
Value Stream Mapping.
Lean tools.
Yamazumi Chart template.
Time Study templates.
DMAIC tools.
Quality Improvement tools.
House of Quality QFD.
FMEA Risk Reduction.
Root Cause Analysis tools.
Problem Solving tools.
OEE.
Preventive Maintenance.
Skip to main content


Installation and Setup
Installation - Each User. Installation - Multi-user. Language Translations. Personalize Your Templates.Systems2win Training.
Quick Start Initial Training. New User Training. Training Matrix. Systems2win Leadership. Training Classes.Lean Training
Lean Training and Coaching. Lean Principles. Muda 8 Wastes. Goal - Lean Flow. Roadmap - Lean Journey. Value Stream Mapping. Standard Work. Hansei Lean Thinking. Lean Dictionary. Online Lean Training. Lean Leadership.Microsoft Office Training
Excel Training. Excel Drawings (without Visio). Excel Charts. Word Training. PDF Training. Document Storage and Naming.Support
Support.Run Chart Template
Excel trend chart template, and line chart template for trend analysis
What is a run chart?
Your Run Chart template (RunChart.xlsx) is the right choice to analyze data and trends over time.
Also consider using your other
Line Chart templates
Trend Chart template (Trends.xlsx)
to organize and analyze more complex data for trend analysis.
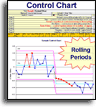
Control Chart template (ControlChart.xlsx)
to alert you when your process is drifting too close to your control boundaries.
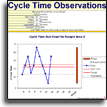
Cycle Time Run Chart (ObservCycles.xlsx) to observe process cycle times.
Sample run chart example
How to use your
Run Chart template
Find and open your template
Find and open your Run Chart template
(RunChart.xlsx)
in the same way that you find and open your other 150+ Systems2win templates.
If you don't yet own a license, you can download your free trial now.
Save your working document
following the usual document storage and naming conventions established by your leaders
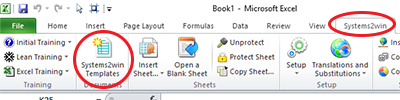
Open a Blank Sheet
When you're ready to start doing your own real work...
click the button to 'Open a Blank Sheet'
Excel Ribbon > Systems2win tab > Open a Blank Sheet
This blank sheet is where you will do your real work
(not on the Sample sheet — which gives you sample data that is extremely helpful for learning how to use your new tool, but is the wrong place to do your real work)
Rename your new sheet.
Or... Insert Sheet
As an alternative to opening a stand-alone document (as instructed above), you also have the option to Insert Sheet into any other Excel workbook.
(which also gives you the option to Link Data so that your chart instantly changes as your data changes)
If English is not your preferred language
Switch to your language, just like every Systems2win Excel template.
Now your team is ready to start using your
Excel Run Chart
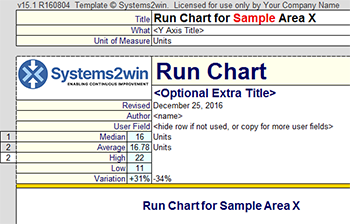
Enter header data
Title
The title that you enter in the top field will also appear as the title in the chart.
You can also optionally enter a second title near the top of the Print Area.
What
In the field called 'What', enter the Y Axis Title
Notice that it appears as the Y Axis Title in your chart.
Unit of Measure
Notice that the value you enter here also appears in other places.
Revised Date
The date that you enter here also appears in the chart.
Do not change the date format.
It must remain in Text format.
Author
The Author is the one person (or team) authorized to make changes to this document.
Enter Data into your
Run Chart template
Enter your primary data in the 'Data' and 'Chart Labels' columns (below the chart).
Tips
Transpose
If you need to transpose between horizontal and vertical data, you can use what you know about familiar Microsoft Excel
Hide Rows
To make the chart look cleaner, hide unused rows.
For more Rows
1) Unprotect the sheet
2) Copy a similar blank row, using Insert Copied Cells
3) Reprotect the sheet
Excel training video
Add, Copy, or Move rows
Optional User Data
Your Run Chart template allows you to easily include up to 3 User Data Series on your chart.
Tips
To make the chart clean, hide unused columns.
The headers that you enter near the top of each user column will appear in the chart Legend.
If your user data series is a straight line, simply enter the number in the pink double-border cell near the top of the column, and notice that in the data cells for that column, the default formula simply uses that value.
If your user data series is not a straight line, then in the data cells for that column, simply delete the default formula (that refers to the default value in the pink cell at the top of each column), and enter your user-defined data in those cells.
Analyze Results in your
Line Chart template
Line Chart data
The obvious purpose of a line chart is to analyze the line chart data
and as explained above, in addition to the primary data series,
your Run Chart template can support up to 3 user-defined data series
Trend Analysis
Right-click the Trend Line in the chart > Format trendline...
Your Trend Line can be Linear, Exponential, Logarithmic, Polynomial, Power, or Moving Average
And you can give your Trend Line a user-defined label that appears in the Legend
To get rid of the Trend Line, right-click > Delete
Median or Average
Use the dropdown list just to the left of the header cells to choose to chart either:
- Median = there are an equal number of values
above or below the median - Average = sum of all data
divided by the number of data entries
High and Low
The highest and lowest values in the primary 'Data' series.
Does not consider optional user-defined data series.
Range
The vertical bar on the right side of your line chart provides a very visual way to show the range of variability in your data.
The bottom of the bar is the lowest data point, and the top is the highest.
Variation
How much does this process vary?
Above and below the Median or Average
Publish and Socialize your Results
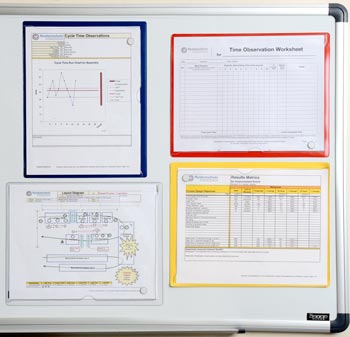
Publish your results where stakeholders can easily see them.
The most common place to publish your results is on your Team Accountability Board, Lean Storyboard, or other Visual Management Systems
Print Options
Option 1) Print as usual
Simply print as usual, using CTRL+P, and everything else you know about printing in familiar Microsoft Excel.
This will print both the chart and the data
unless you change the Print Area.
Option 2) Print sections
Use the special Systems2win Print buttons to print:
Print Area 1 - the Chart page
Print Area 2 - the primary Data
Print Area 3 - optional User Data
Option 3) Print just the chart
Use the the Copy Chart button
Excel Ribbon bar > Systems2win menu > Copy Chart
which will copy just the chart by itself to the clipboard, where you can then paste it into any other document.
Excel Line Chart template for Advanced Trend Analysis
Even if you came looking for a simple run chart template, you're probably going to end up liking this trend chart template even better
Do you have a "real world" amount of historical data?
Not just 1 or 2 weeks of anecdotal data?
Your Trends.xlsx template provides a clean system to organize, archive, and analyze large amounts of data, with a really helpful system to organize and archive summarized history.
See the training video for Run Chart Trend Analysis.
How do you want to spend your time?
Analyzing trends?
Or creating Excel charts?
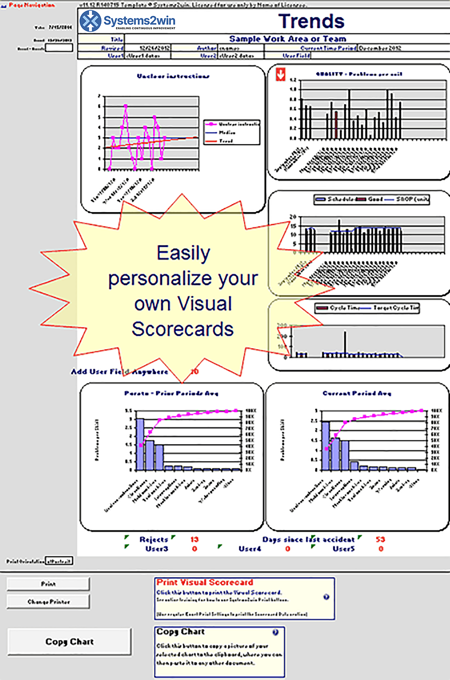
Run Chart template features
Your Systems2win Trend Charts template has a LOT of features that you won't find in a standard Excel Line Chart.
It makes it really easy to simply drag different types of trend charts into and out of the Print Area.
These trend charts correctly show zero and blank values within the days for which you have data, and correctly don't mess up the trend line with false zero values for tomorrow and the rest of the month.
These trend charts allow you to easily chart ANY column of data
just by specifying the column letter.
Easily choose from a dropdown list to chart the Median or the Average.
When you choose a column of data, it actually populates 2 charts of the same data:
- A classic Run Chart
- A bar chart that shows the Current Period data right alongside the averages for prior periods
so that you can analyze trends.
(oh yeah... the reason for doing this in the first place...)
It even comes with side-by-side Pareto Charts so that you can see your current period Pareto data right alongside the Pareto data for any chosen prior period so that you can analyze trends.
The run chart template, trend chart template, control chart template, and Cycle Time Run Chart all come with many other useful Quality Improvement Tools
New User Training
Your Systems2win templates come with free New User Training
to quickly learn features that are common to all 150+ templates
Contents
Training and Coaching
Consider Training and Coaching to support your teams to succeed
Training to get you started.
Tools you won't outgrow.
Schedule a Conference
Schedule a conference
to discuss your challenges
with an experienced lean advisor
The right DMAIC tools
to Define, Measure, Analyze, Improve, and Control
the quality of ANY process
Tell a Colleague
Own Yours Now
If your organization has
not yet provided a license,
own yours now
150+ Templates
Try Some
Own Them All
Download Trial Now
Get a dozen trial templates,
and another dozen free gifts
@@@ Better conversion rate
if call to action is for a specific tool, and shows the image
Try It
Try this template
along with a couple dozen more
process improvement tools
Calls to Action Botttom

Related Topics
Related Topics section WITHOUT TESTIMONIALS
Replace this paragraph with menu library item for topics related to this video
Training and Coaching
Consider Training and Coaching to support your teams to succeed
Training to get you started.
Tools you won't outgrow.
Schedule a Conference
Schedule a conference
to discuss your challenges
with an experienced lean advisor